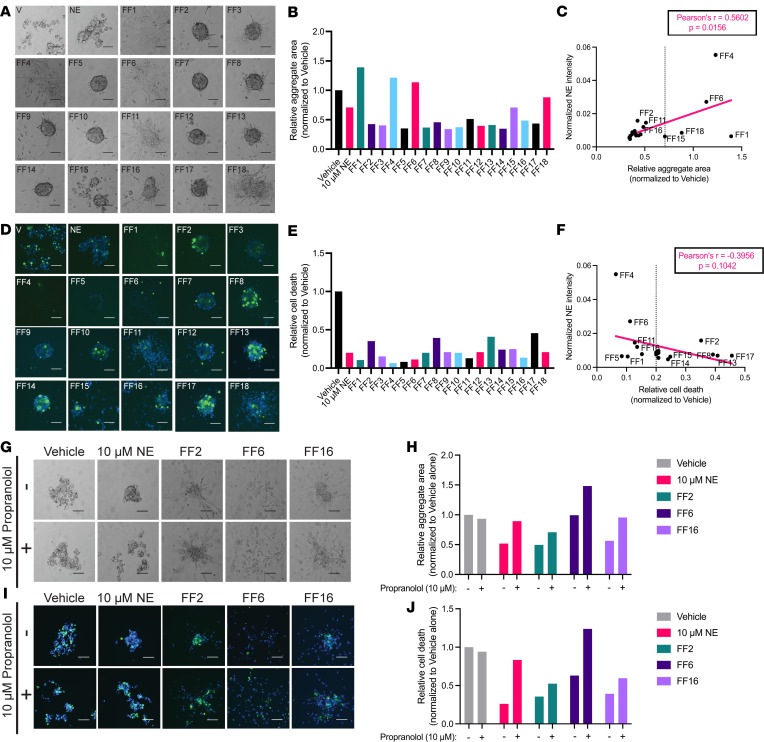
Figure 4. Propranolol abrogates morphological and survival changes imparted by NE-rich human FF.
(A and B) Bright-field images and area measurements for FT246 cells treated for 24 hours in ULA culture with 18 different FF samples collected from 17 different patients (10% volume). (C) Linear regression for correlation between FT246 aggregate area and relative NE concentration quantified via mass spectrometry analysis. (D) Fluorescence images of total cells (blue) and dead cells (green), quantified in E, for each FT246 cell aggregate, cultured as in A. (F) Linear regression for correlation between the number of dead cells in FT246 aggregates and relative NE concentration per sample. (G and H) Bright-field images and area measurements for FT246 cells treated with vehicle, NE, FF2, FF6, or FF16 in the presence or absence of 10 μM propranolol. (I and J) Fluorescence images and dead cell quantification for cells as cultured in G. These images were all taken at 10× original magnification and scale bars represent 100 µm. Each experiment was conducted in technical triplicate for each biological sample (n = 1).

