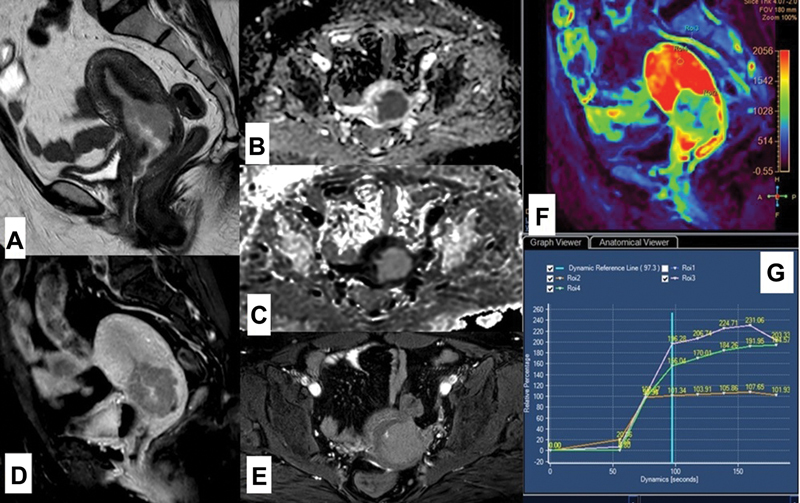
Fig. 5.

A 45-year-old female with grade 3 endometrioid and serous endometrial adenocarcinoma underwent magnetic resonance imaging (MRI) pelvis with contrast for staging. ( A ) T2-weighted sagittal image and ( B, C ) diffusion-weighted imaging with apparent diffusion coefficient map show T2 intermediate signal diffusion restricting growth in the endometrial cavity (*) and endocervical region with myometrial and posterior cervical stromal infiltration. ( D ) Post-contrast sagittal image showing poor enhancement of the endometrial mass in comparison with the myometrium. ( E ) Delayed axial post-contrast image shows persistent enhancement. ( F ) Color map showing prominent differentiation of the perfusion hue. ( G ) Kinetic curves of dynamic contrast-enhanced MRI compared contrast enhancement kinetics of the external iliac artery (top pink curve) with rapid and steep curve, myometrium with steep early wash-in (green curve) and the mass in the endometrium and endocervix showing slower and stunted wash-in (orange curve) and persistent plateau. This patient was staged as IIC endometrial cancer.
