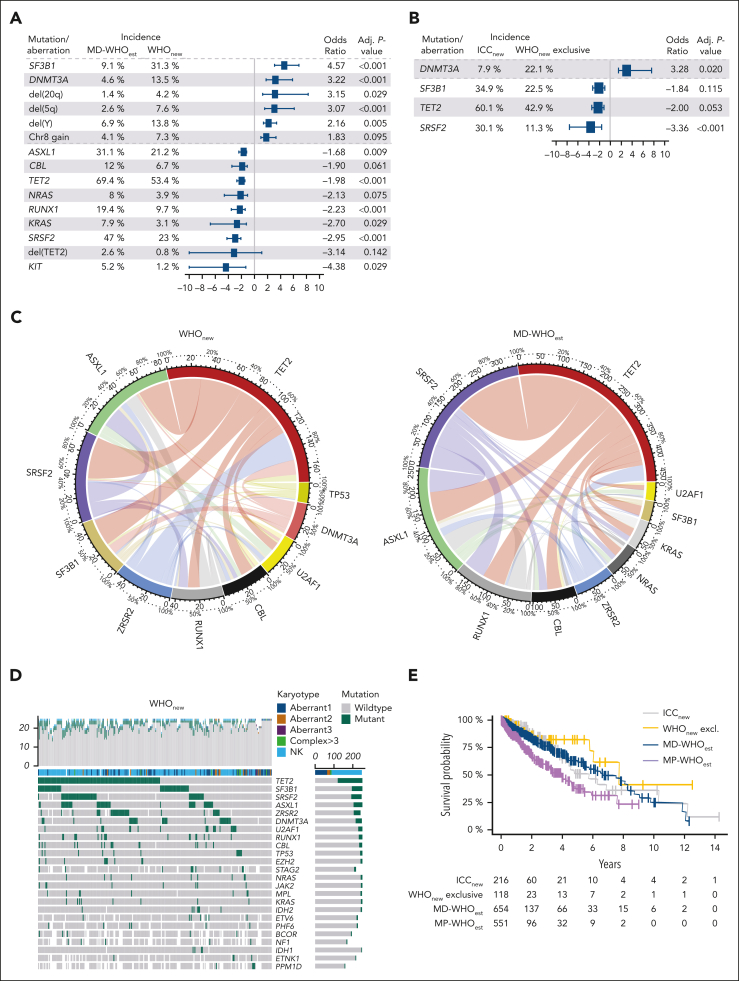
Figure 3.
Molecular data analysis of MD-WHOest, WHOnew, and ICCnew cases. (A-B) Forest Plots comparing the incidences and ORs of 15 alterations significantly differing between 654 MD-WHOest and 356 WHOnew cases (A) and 4 alterations significantly differing between 241 ICCnew and 127 WHOnew exclusive cases (B). (C) Circos plots showing the comutational profile of 251 WHOnew (left) and 474 MD-WHOnew (right) cases with >20 genes sequenced. (D) Mutations were identified by NGS in 251 WHOnew patients with >20 genes sequenced. The 24 mutations with highest incidence and respective karyotypes are depicted, ordered from the most to the least frequently mutated, with each column representing a patient and each row representing a gene. The number of mutations identified/genes sequenced per patient is shown as columns in the top row. (E) Kaplan-Meier curves of the ICCnew, WHOnew exclusive, MD-WHOest, and MP-WHOest cohorts. WHOnew and ICCest cases showed a median OS of 7.7 and 5.7 years (P = .520 and P = .796 vs MD-CMMLest, respectively), vs 7.5 years in MD-WHOest and 3.3 years in MP-WHOest. Aberrant1-3, 1-3 cytogenetic aberrancies; Complex >3, complex karyotype with >3 cytogenetic aberrancies; NGS, next-generation sequencing; NK, normal karyotype.

