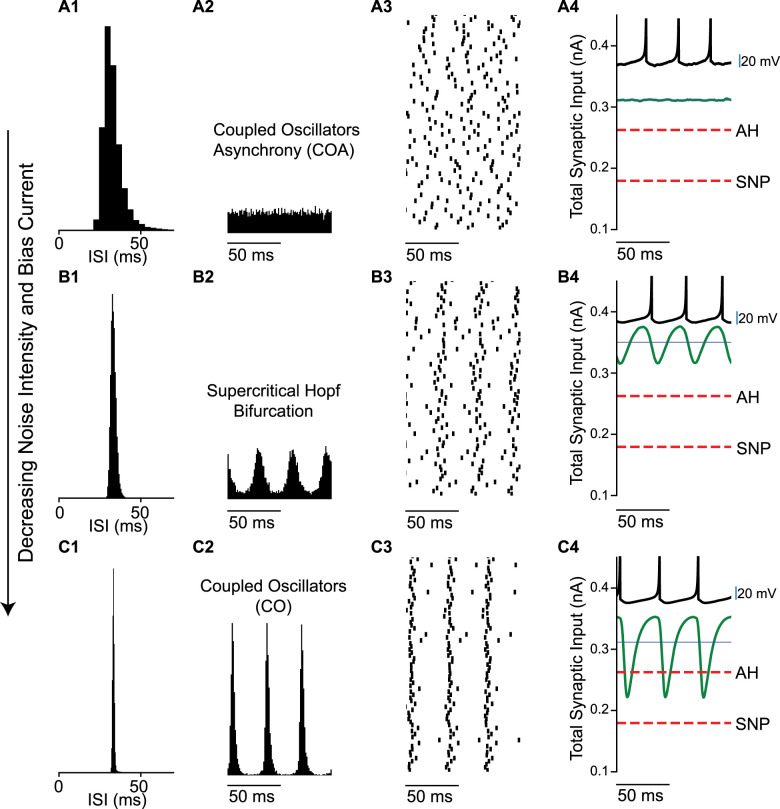
Figure 3.
Transition from coupled oscillator asynchrony to coupled oscillator synchrony in a network of Type 2 neurons with decreasing noise intensity and bias current. A, At high noise, the asynchronous state has a stationary mean firing rate (noise intensity is 0.56 nA and bias current is 0.428 nA). A1. ISI histogram. A2. Spike time histogram. A3. Raster plot (down-sampled to 71 out of 3,000 neurons). A4. Current relative to threshold. Threshold at the saddle node (SN, red dashes) bifurcation, total synaptic input current averaged over the network (green), and mean current for single neurons (blue line). B, Transition from network asynchrony to synchrony (noise intensity is 0.14 nA and bias current is 0.398 nA). B1–4 as in A1–4. Spikes per cycle (SPC) is 0.98. C, Coupled oscillator synchrony (noise intensity is 0.05 nA and bias current is 0.359 nA). C1–4 as in A1–4. SPC is 0.99. In all the three cases the synaptic strength is 0.16 nA and mean firing rate is 30 Hz. All units are per cm2.

