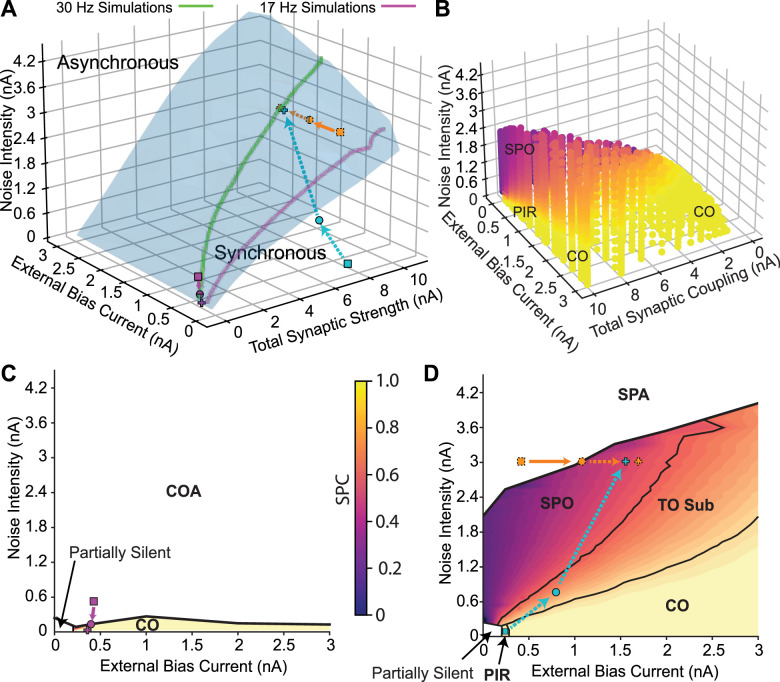
Figure 5.
Transitions in the full 3D parameter space. A, Bifurcation in the full 3D parameter space. The points corresponding to Figures 1–3 are depicted in orange, cyan and purple, respectively. Dashed arrows depict transition in the synchronous region, full arrows correspond to asynchronous region. B, Transition from coupled oscillator synchrony to SPO. The color code indicates the spikes per cycle (SPC), which is the average fraction of oscillation cycles in which an individual neuron spikes. Population oscillations disappear on the upper surface of the colored region, which is the Hopf bifurcation surface from a different perspective than that shown (in A). C, Plane depicting the low coupling region of the 3D space. The transition is from coupled oscillators synchrony (CO) to coupled oscillators asynchrony (COA). Total synaptic coupling is 0.16 nA. D, Plane depicting the high coupling region of the 3D space. Total synaptic coupling is 7.94 nA. All units are given per cm2.

