
Figure 9.
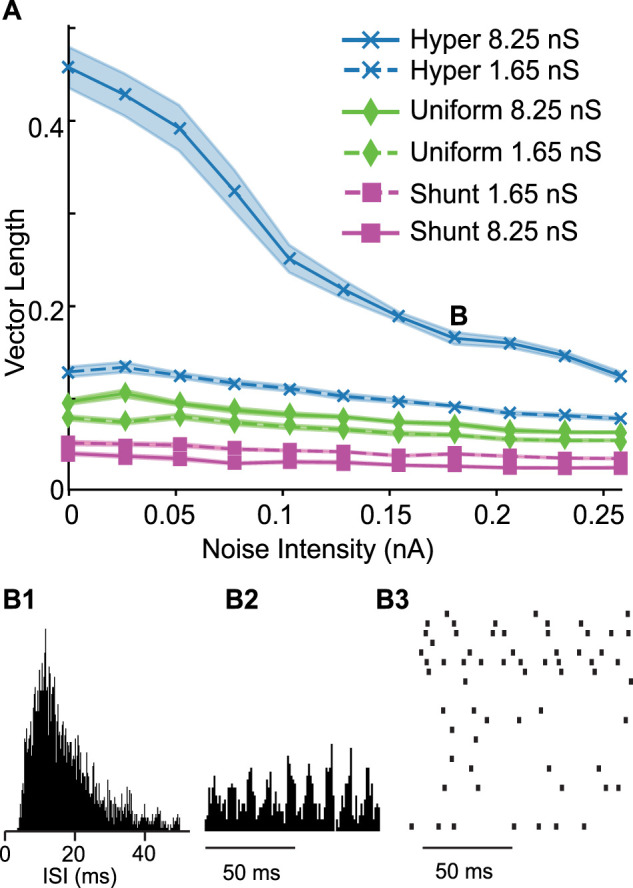
Comparison of different kinds of inhibition in a heterogeneous network. A, Average vector length at different noise levels. Shaded area shows the standard error of the mean. Dashed lines are for the weaker conductance value. The labels are in the same order as the traces. B, SPO. B1, ISI histogram. B2, Spike time histogram. B3, Down-sampled raster.