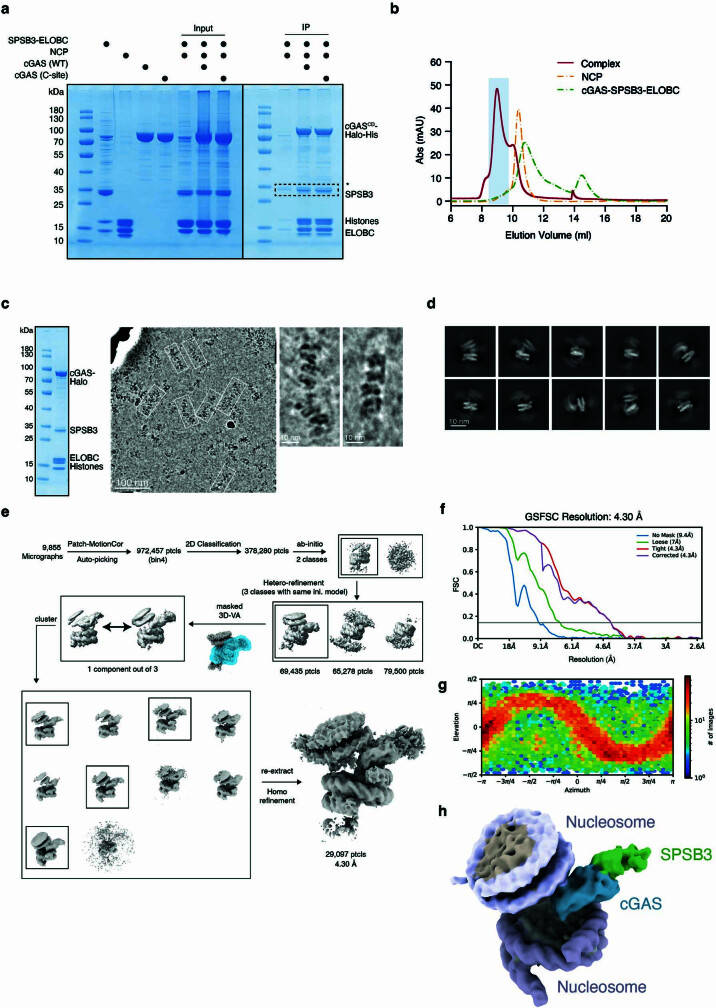
Extended Data Fig. 6. Purification and cryo-EM data processing of nucleosome-bound cGAS in complex with SPSB3-ELOBC.
a, In vitro Ni-NTA pull-down assaying nucleosome-bound His-Halo-tagged wild-type (WT) cGAS or site C mutant cGAS (K285A/R300A/K427A) complex formation with the SPSB3-ELOBC heterotrimer. b, Size-exclusion chromatography of nucleosome-bound cGAS in complex with SPSB3-ELOBC. c, Left: Coomassie blue staining SDS-PAGE and cryo-EM analysis of the complex peak (red) shown in (b). Middle: Representative micrograph of the nucleosome-cGAS-SPSB3-ELOBC complex in vitrified ice from 9,855 raw images. Scale bar, 100 nm. Right: Zoomed-in cutaways highlighting the complex fibre. Scale bar, 10 nm. d, Selected 2D class averages of nucleosome-cGAS-SPSB3-ELOBC complex particles. Scale bar, 10 nm. e, Cryo-EM data processing flow chart. f, Corrected gold-standard Fourier shell correlation (FSC) curves of the nucleosome-cGAS-SPSB3-ELOBC complex for the 3D EM reconstruction maps. g, Angular distribution of nucleosome-cGAS-SPSB3-ELOBC complex particles included in the final reconstruction. h, Final 3D reconstruction of the nucleosome-cGAS-SPSB3-ELOBC complex; cGAS in blue, SPSB3 in green, nucleosomal DNA in lilac, histones in grey. One representative of at least three independent experiments is shown (a, b, c).

