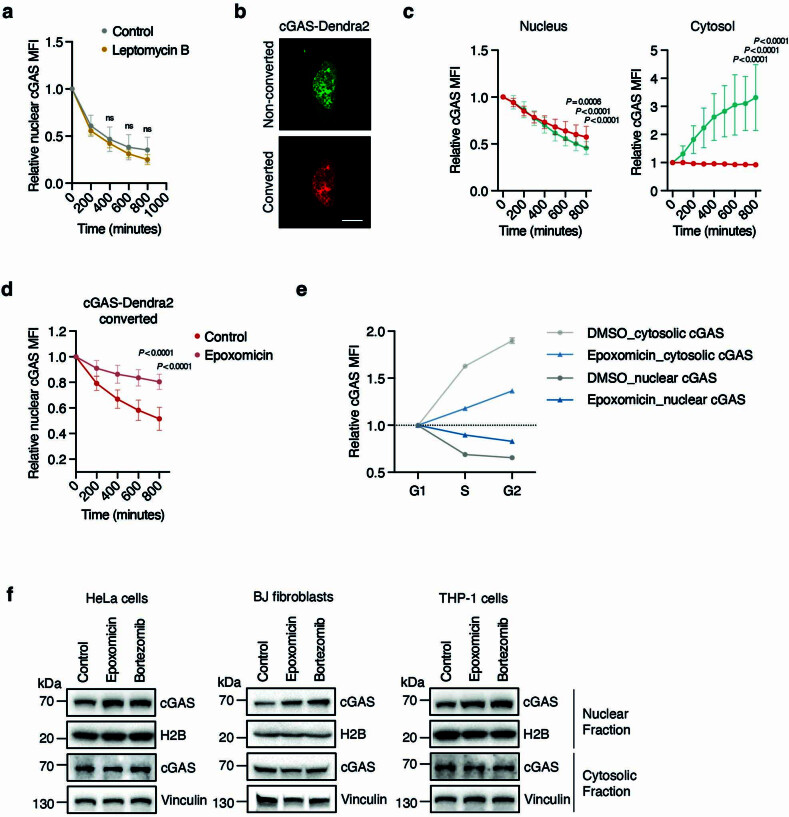
Extended Data Fig. 2. SPSB3 and CUL5 control nuclear cGAS levels.
a, Relative nuclear cGAS-GFP MFI in post-mitotic HeLa cells treated with leptomycin B (n = 20) or DMSO (n = 12). b, Representative image of a HeLa cell expressing cGAS-Dendra2 before and after photoconversion. Scale bar, 10 μm. c, Relative cGAS-Dendra2 MFI in the nucleus (left; n = 28 cells per condition) or cytoplasm (right; n = 29 cells per condition) in cells that underwent photoconversion (red) or not (green). d, Relative nuclear photoconverted cGAS-Dendra2 MFI measurement in post-mitotic HeLa cells treated with epoxomicin (n = 27) or DMSO (n = 25). e, QIBC analysis of endogenous cGAS levels in HeLa cells treated with epoxomicin or DMSO. f, Cytosolic and nuclear fractions were extracted from indicated cells treated with DMSO, epoxomicin or bortezomib for 16 h and analysed by immunoblot. Vinculin and H2B were used as loading control for cytosolic and nuclear fractions, respectively. Data are mean ± SD (a, c, d) or mean ± SEM (e). Numbers indicate individual cells (a, c, d). P values were obtained by two-way ANOVA with Šídák’s multiple comparison test (a, c, d). One representative of three (f) independent experiments is shown.

