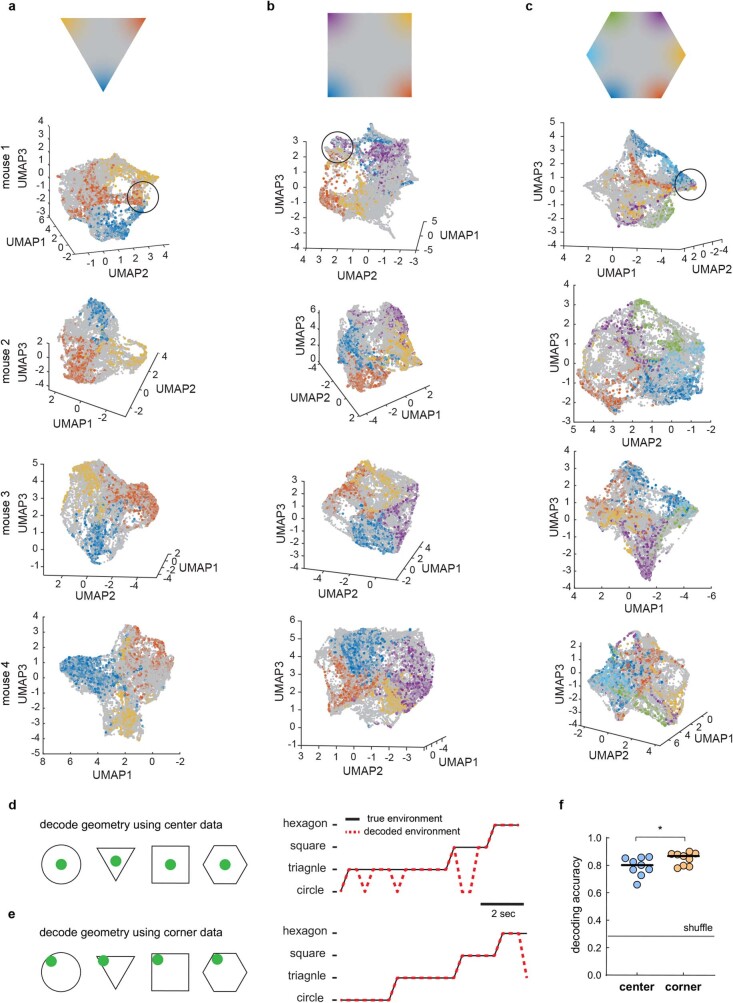
Extended Data Fig. 5. Neural manifold embedding and geometry decoding.
(a) Three-dimensional (3D) embedding of the population activity of recorded subiculum neurons in the triangle from four different mice. We applied a sequential dimensionality reduction method using PCA and UMAP to obtain this neural manifold embedding (Methods). Each dot represents the population state at one time point. Time points within 5 cm of the corners are color-coded, with the color graded to grey as a function of the distance away from the corner (top row). The example from mouse 1 is the same as Fig. 1k but from a rotated view. The black circle denotes the place that corner representations converged on each manifold. (b) same as (a), but in the square environment. (c) same as (a), but in the hexagon environment. For a-c, analyses were replicated in 9 mice with similar results. (d) Left: Schematic of using the data from the environmental centre (8 cm diameter) to decode the environmental identity (geometry). Right: A decoding example to predict the geometry of the environment. (e) Left: Schematic of using the data near (within 8 cm) a geometric feature of the environment (e.g., a corner) to decode the environmental identity (geometry). Right: A decoding example to predict the geometry of the environment. (f) Comparison of decoding accuracy in (d) and (e) (mean ± SEM: center vs. corner: 0.79 ± 0.02 vs. 0.85 ± 0.02; two-tailed Wilcoxon signed-rank test: p = 0.019; n = 9 mice).

