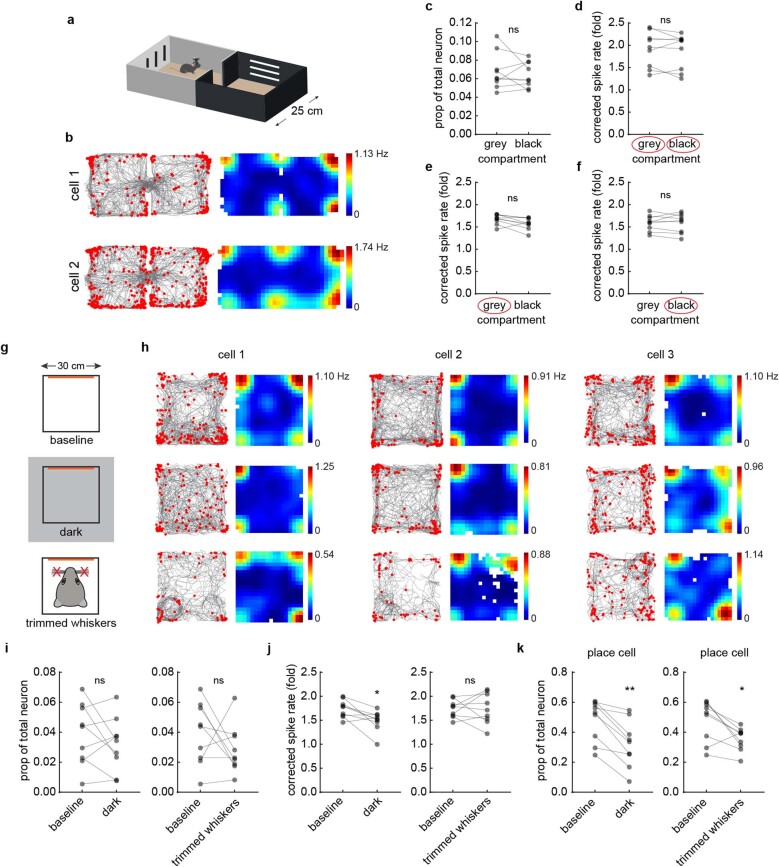
Extended Data Fig. 6. The response of corner cells to non-geometric and sensory manipulations.
(a) Schematic of a shuttle box composed of two compartments that differed in their visual and tactile cues. (b) Two example corner cells from two different mice recorded in the shuttle box shown in (a). Raster plot (left) indicates extracted spikes (red dots) on top of the animal’s running trajectory (grey lines) and the spatial rate map (right) is color-coded for maximum (red) and minimum (blue) values. (c) Proportion of neurons classified as corner cells in the grey vs. black compartments of the shuttle box (two-tailed Wilcoxon signed-rank test: p = 0.91; n = 9 mice). ns: not significant. (d) Average corrected peak spike rates of corner cells at the corners in the grey vs. black compartments (two-tailed Wilcoxon signed-rank test: p = 0.43; n = 9 mice). Corner cells included in this quantification were defined as corner cells in both grey and black compartments. (e) Same as (d), but using corner cells that defined in the grey compartment (two-tailed Wilcoxon signed-rank test: p = 0.07). (f) Same as (d), but using corner cells that defined in the black compartment (two-tailed Wilcoxon signed-rank test: p = 0.91). (g) Schematic of imaging in the dark or after trimming the whiskers. Orange bars indicate the location of local visual cues. (h) Raster plots and the corresponding rate maps of three corner cells from three different mice, as in (b). Each column is a neuron with activity tracked across all the conditions indicated on the left. (i) Left: Proportion of corner cells compared between baseline and dark (two-tailed Wilcoxon signed-rank test: p = 0.50; n = 9 mice). Right: Proportions of corner cells compared between baseline and whisker trimming (two-tailed Wilcoxon signed-rank test: p = 0.46, n = 9 mice). (j) Left: Comparison of the corrected peak spike rates of corner cells at square corners between baseline and dark (two-tailed Wilcoxon signed-rank test: p = 0.019; n = 9 mice). Right: Comparison of the corrected peak spike rates of corner cells at square corners between baseline and whisker trimming (two-tailed Wilcoxon signed-rank test: p > 0.99; n = 9 mice). (k) Same as (i), but for neurons classified as place cells in the subiculum (two-tailed Wilcoxon signed-rank test: left: p = 0.0039; right: p = 0.019; n = 9 sessions from 9 mice).

