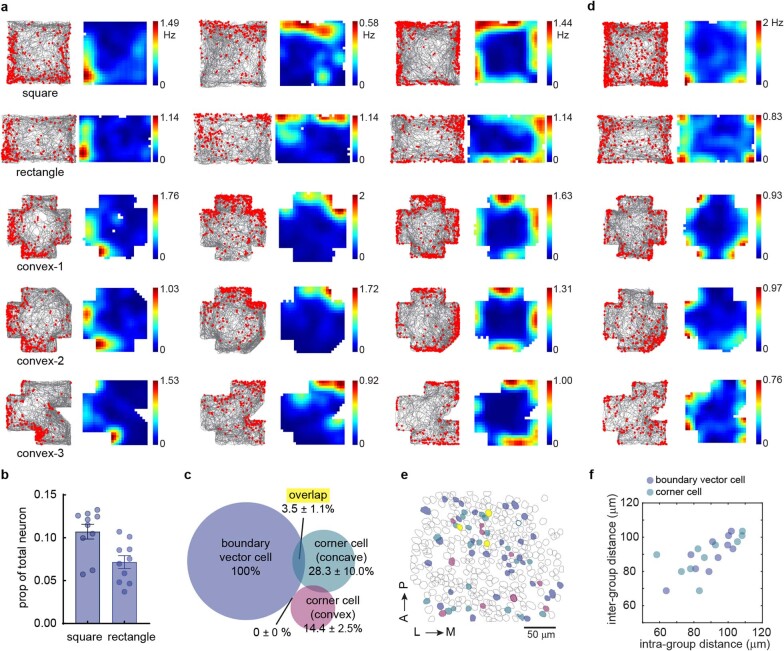
Extended Data Fig. 10. Corner coding differs from boundary vector coding in the subiculum.
(a) Raster plots and rate maps of three boundary vector cells (BVCs) from three different mice, plotted as in Fig. 1f. BVCs were identified in the square environment. Each column is a cell in which its activity was tracked across sessions. (b) Proportion of neurons classified as BVCs in the square and rectangle sessions. Each dot represents a session (n = 10 mice). Histogram and error bars indicate mean ± SEM. (c) Venn diagram showing the overlap between BVCs and corner cells (concave or convex). BVCs and corner cells encoding concave corners were identified in the square environment, while corner cells encoding convex corners were identified in the convex-1 arena. All numbers were normalized to the number of BVCs. The overlap between corner cells and BVCs (3.5 ± 1.1%) was not higher than the threshold above the random overlap level (12.5%) (d) An example neuron classified as both a BVC and corner cell based on its activity in the square environment. (e) Anatomical locations of BVCs and corner cells (concave or convex) from a representative mouse. Color codes are the same as in (c). Unfilled grey circles represent other subicular neurons. A: anterior; P: posterior; L: lateral; M: medial. (f) Pairwise intra- vs. inter-group anatomical distances for BVCs and corner cells (concave + convex) (repeated measures ANOVA: F(1.37, 12.36) = 0.30, p = 0.66; n = 10 mice).

