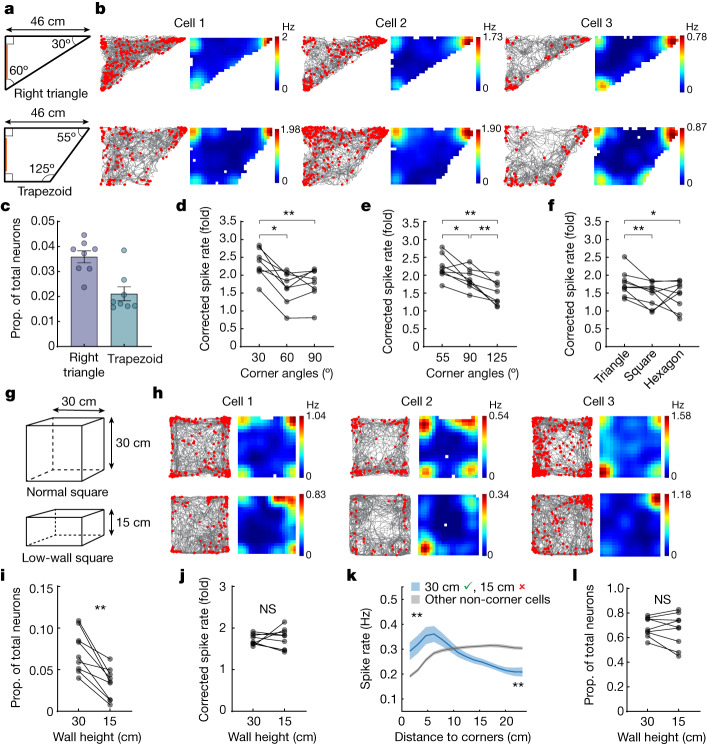
Fig. 2. Corner cell coding is sensitive to corner angle and wall height.
a, Asymmetric arena shapes. Orange indicates visual cues. b, Three representative corner cells from three mice, plotted as in Fig. 1f. c, Proportion of corner cells in each environment. Each mouse averaged from two sessions (mean ± s.e.m.; n = 8 mice). d, Corrected peak spike rates of corner cells at each right triangle corner (repeated measures ANOVA: F(1.65, 11.53) = 18.54, P = 0.0004; 30° versus 60°: P = 0.016; 30° versus 90°: P = 0.0078; 60° versus 90°: P = 0.31; n = 8 mice). e, Same as d, for trapezoid (repeated measures ANOVA: F(1.85, 12.97) = 23.94, P < 0.0001; 55° versus 90°: P = 0.023; 55° versus 125°: P = 0.0078; 90° versus 125°: P = 0.0078; n = 8 mice). f, Corrected peak spike rates of across-session corner cells in different environments (arena shapes, x-axis; repeated measures ANOVA: F(2,16) = 3.88, P = 0.042; triangle versus square: P = 0.0078; triangle versus hexagon: P = 0.039; square versus hexagon: P = 0.91; n = 9 mice). g, Schematic of normal versus low-wall squares. h, Three representative corner cells from three mice, plotted as in b. i, Proportion of corner cells in 30 versus 15 cm square (P = 0.0039; n = 9 mice). j, Corrected peak spike rates of corner cells in 30 and 15 cm square (P = 0.73). k, Spike rates relative to the distance from the nearest corner in the 15 cm square. Blue curve denotes neurons that were corner cells in the 30 cm (green check) but not the 15 cm square (red cross). Blue and grey curves, approximately 5 cm from either the curve’s head or tail, were compared (all P = 0.0039). Solid line, mean; shaded area, s.e.m. l, Same as i, for place cells (P = 0.50). Pairwise comparisons throughout the figure use two-tailed Wilcoxon signed-rank test. NS, not significant.

