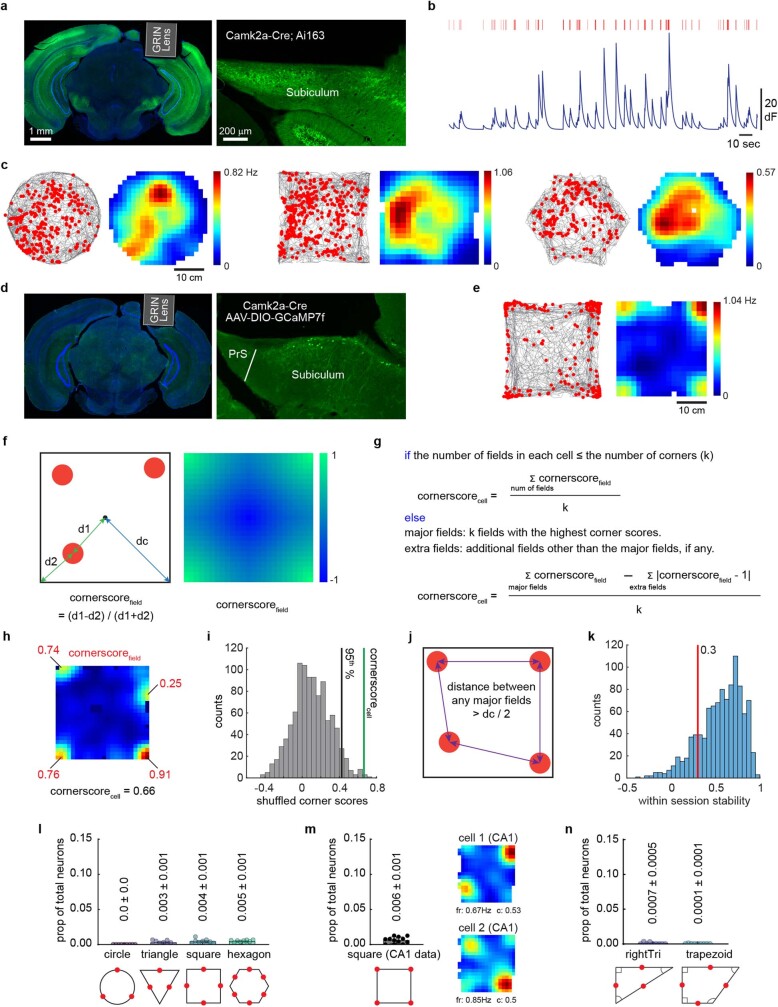
Extended Data Fig. 1. Histology and the development of a score to classify corner cells.
(a) Histology of GRIN lens implantation in the dorsal subiculum of an example Camk2a-Cre; Ai163 mouse. Green: GCaMP6, Blue: DAPI. Right, enlarged view of GCaMP6-expressing subiculum neurons. The experiment was replicated in 8 mice with similar results. (b) Representative de-noised calcium signal traces (dark blue) and de-convolved inferred spikes (red bars) extracted from CNMF-E. (c) Raster plots and rate maps of a representative place cell in the subiculum. Raster plot (left) indicates extracted spikes (red dots) on top of the animal’s running trajectory (grey lines) and the spatial rate map (right) is colour-coded for maximum (red) and minimum (blue) values. Activity was tracked across different environments. (d) Same as (a), but from a Camk2a-Cre mouse with AAV-DIO-GCaMP7f injected in the subiculum. GCaMP expression was restricted to the subiculum. PrS: presubiculum. (e) An example corner cell from the animal in (d), plotted as in (c). (f) Left, the definition of corner score for a given spatial field (cornerscorefield). d1: distance from the centre of the arena to the field; d2: distance from the field to the nearest corner; dc: the mean distance from the corners to the centre of the arena. Right, the distribution of cornerscorefield in a square environment. This represents the expected corner score if a neuron were active in a given pixel of this plot. Note that the cornerscore can range from −1 (blue) to 1 (green). (g) The definition of the corner score for a given cell (cornerscorecell, see Methods). (h) An example corner cell with corner score values for each field labeled in red, the final corner score for this cell is shown below. (i) Shuffling of cornerscorecell to determine a threshold for classifying a neuron as a corner cell. This example is from the same cell as in (h). See also Extended Data Fig. 2a–d and Methods. (j) To be classified as a corner cell, the distance between any two fields (major fields, if the number of fields > number of corners) needed to be greater than half of the dc value, as indicated by the blue line in (f). (k) As an additional criterion, to be classified as a corner cell, within-session stability needed to be greater than 0.3 (Pearson’s correlation between the two halves of the data). The distribution shows the within-session stability of all corner cells from the triangle, square, and hexagon sessions before applying this criterion (n = 1018 cells from 9 mice). (l) Proportion of neurons that passed the definition for a corner cell when corners of the environments were manually assigned to the walls. Red dots in the bottom schematic denote the locations that were assigned as ‘corners’. (m) Left: Proportion of corner cells in CA1 (n = 12 mice). Right: Rate maps of two example CA1 corner cells. Peak spike rates (fr) and corner scores (c) for the cells are indicated at the bottom. (n) Same as (l), but for the right triangle and trapezoid environments.

