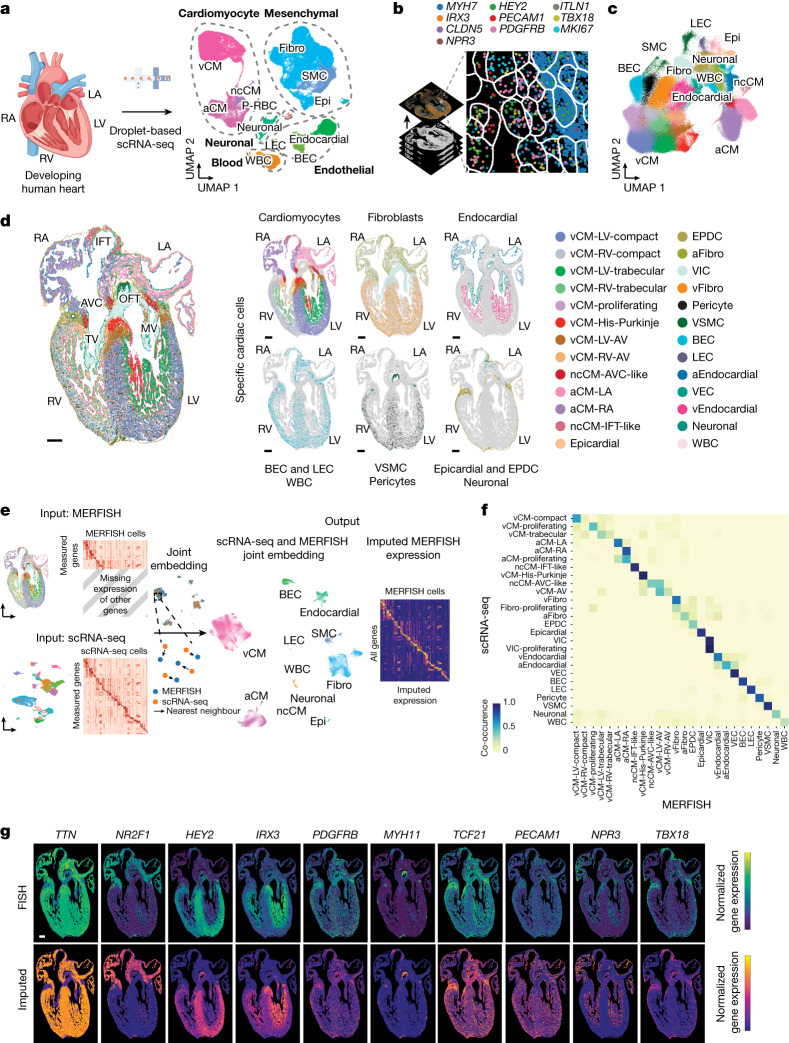
Fig. 1. Molecular and spatial human heart cell atlases reveal a diverse range of cell populations during heart development.
a, Left, schematic of experiment. Right, scRNA-seq identifies a diverse range of distinct cardiac cells that create the developing human heart as displayed by uniform manifold approximation and projection (UMAP) of ~143,000 cells. b, Schematic shows how 238 cardiac-cell-specific genes were spatially identified using MERFISH. Pseudo-coloured dots mark the location of individual molecules of ten specific RNA transcripts. c, Approximately 250,000 MERFISH-identified cardiac cells were clustered into specific cell populations as shown by UMAP and coloured accordingly in d. d, Identified MERFISH cells were spatially mapped across a frontal section of a 13 p.c.w. heart (left) and shown according to major cell classes (right). e, Joint embedding between MERFISH and age-matched scRNA-seq datasets enabled cell label transfer and MERFISH gene imputation. f, Co-occurrence heatmap shows the correspondence of cell annotations of MERFISH cells to those transferred from the 13 p.c.w. scRNA-seq dataset. g, Gene imputation performance was validated spatially by comparing normalized gene expression profiles of marker genes measured by MERFISH with the corresponding imputed gene expression profiles. Epi, epicardial; MV, mitral valve; P–RBC, platelet–red blood cell; TV, tricuspid valve. Scale bar, 250 µm (g). Illustration in a was created using BioRender (https://www.biorender.com).

