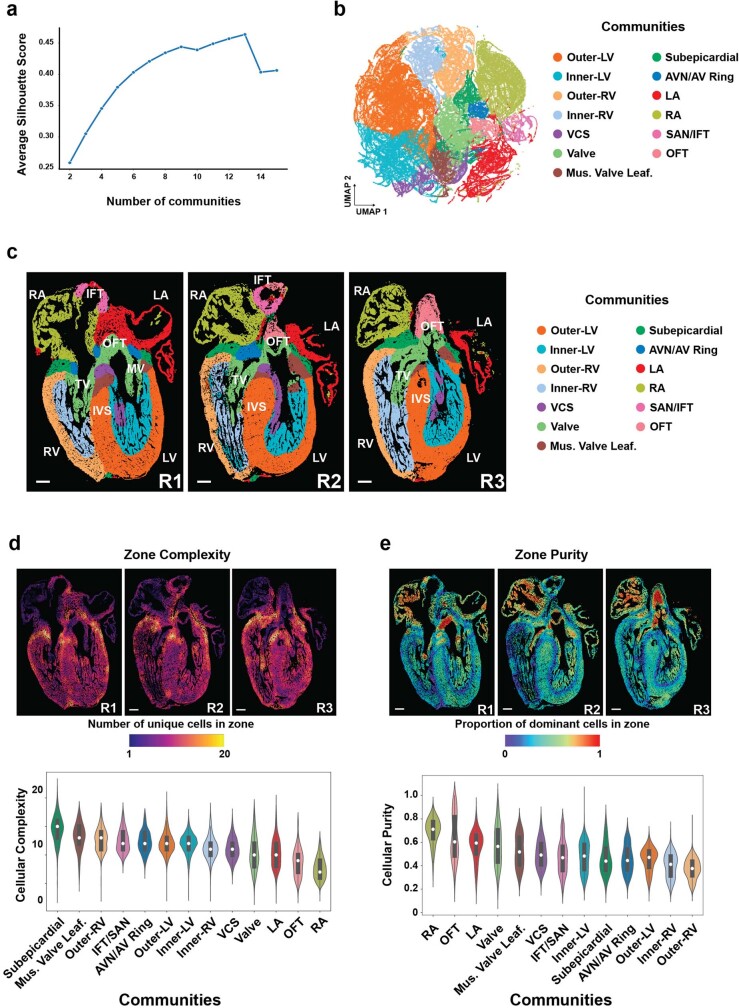
Extended Data Fig. 5. Cell zone analyses reveal the complexity and purity of the cellular communities (CCs).
a, Plot of average silhouette scores reveals that the statistically optimal number of cellular communities is thirteen. b, ~250,000 cell zones were grouped into specific cellular communities as shown by UMAP and colored by community. c, Spatial mapping of these CCs onto three different sections of the 13 p.c.w. (post conception weeks) heart shows the reproducibility of CCs corresponding to specific anatomic cardiac structures. The distribution of (d) cell zone complexity and (e) purity is displayed both spatially for replicate sections of 13 p.c.w. hearts (zone complexity/purity maps) and quantitatively in violin plots. The center white dot represents the median, the bold black line represents the interquartile range, and the edges define minima and maxima of the distribution. AVC, atrioventricular canal; AVN, atrioventricular node; IFT, inflow tract; IVS, interventricular septum; LA, left atrium; LV, left ventricle; Mus. Valve Leaf., muscular valve leaflet; MV, mitral valve; OFT, outflow tract; RA, right atrium; RV, right ventricle; SAN, sinoatrial node; TV, tricuspid valve; VCS, ventricular conduction system. Scale bar, 250 µm.

