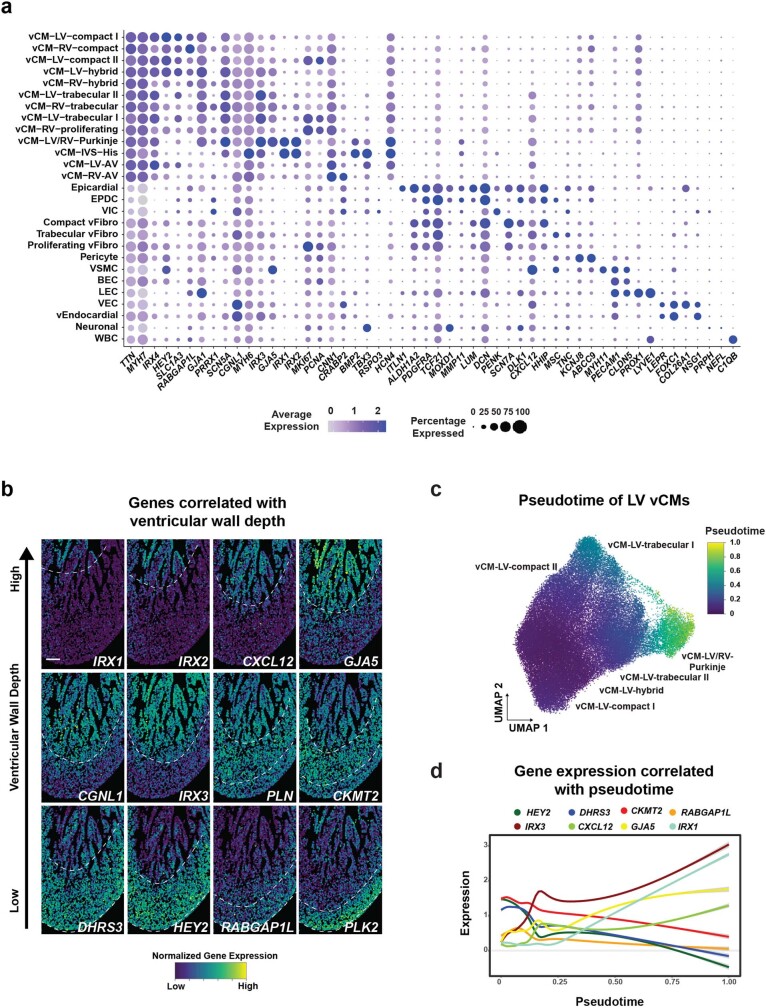
Extended Data Fig. 6. Gene marker analysis defined distinct ventricular MERFISH cells and their molecular relationship to ventricular wall depth and pseudotime.
a, Gene marker analysis defined MERFISH cells clustered from only the ventricles. b, MERFISH images reveal that spatial expression of genes related to specific vCMs correlate with ventricular wall depth. c, UMAP shows pseudotime of these vCMs within the left ventricular wall. d, Gene expression of specific markers for each distinct vCM is plotted along the pseudotime axis. Colored lines indicate each gene examined (see legend above plots). BEC, blood endothelial cell; EPDC, epicardial-derived cell; IVS, interventricular septum; LEC, lymphatic endothelial cell; LV, left ventricle; RV, right ventricle; vCM, ventricular cardiomyocyte; vCM-LV/RV-AV, muscular valve leaflet vCM; VEC, valve endocardial cell; vEndocardial, ventricular endocardial; vFibro, ventricular fibroblast; VIC, valve interstitial cell; VSMC, vascular smooth muscle cell; WBC, white blood cell. Scale bar, 250 µm.

