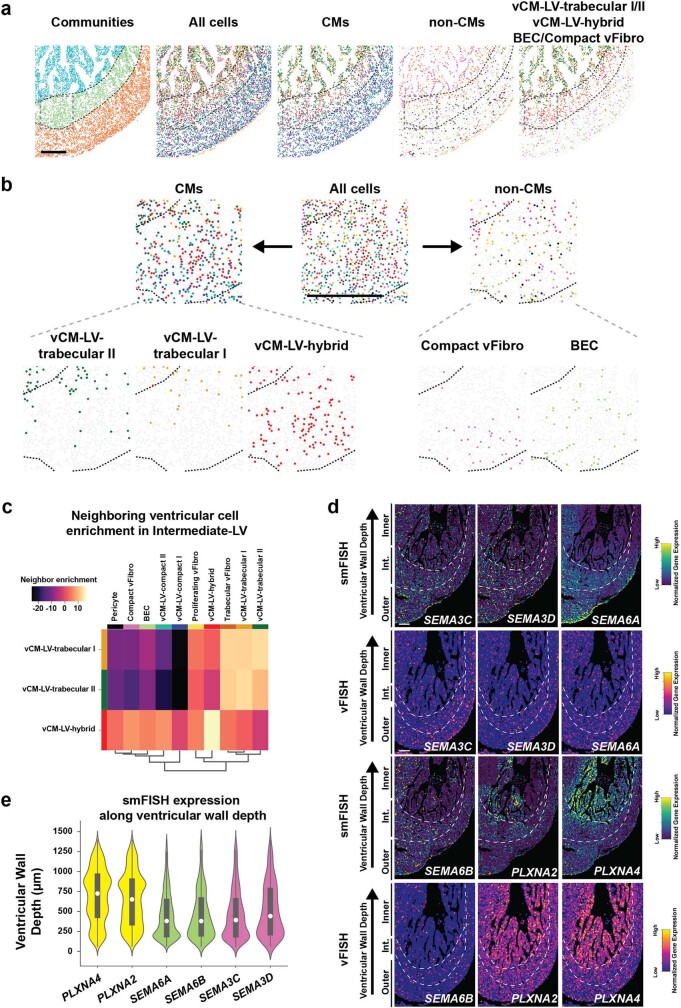
Extended Data Fig. 11. Distinct ventricular cells cooperating in plexin-semaphorin signaling display complementary but overlapping spatial distributions within the ventricular wall.
a, The distribution of distinct ventricular cardiac cells participating in SEMA3C/3D/6 A/6B - PLXNA2/4 interactions is shown within the left ventricular wall. Cells are colored by community and identity as indicated in Fig. 3b. b, Magnified view of boxed area in (a) reveals how these cells spatially organize in the Intermediate-LV CC. c, Neighborhood enrichment plot of Intermediate-LV CC shows that vCM-LV-Trabecular I, vCM-LV-Trabecular II, vCM-LV-Hybrid are closer to BECs than Compact vFibro. d, smFISH and imputed spatial expression (vFISH) analyses show the spatial gene expression of interacting semaphorin ligands and plexin receptors. e, Violin plot shows the level of expression (smFISH) for each of the semaphorin ligands and plexin receptors across the ventricular wall depth. The center white dot represents the median, the bold black line represents the interquartile range, and the edges define minima and maxima of the distribution. BEC, blood endothelial cell; CC cellular community; CM, cardiomyocyte; Int., intermediate; LV, left ventricle; smFISH, single molecule fluorescent in situ hybridization; vCM, ventricular cardiomyocyte; vFibro, ventricular fibroblast; vFISH, virtual fluorescent in situ hybridization. Scale bar, 250 µm.

