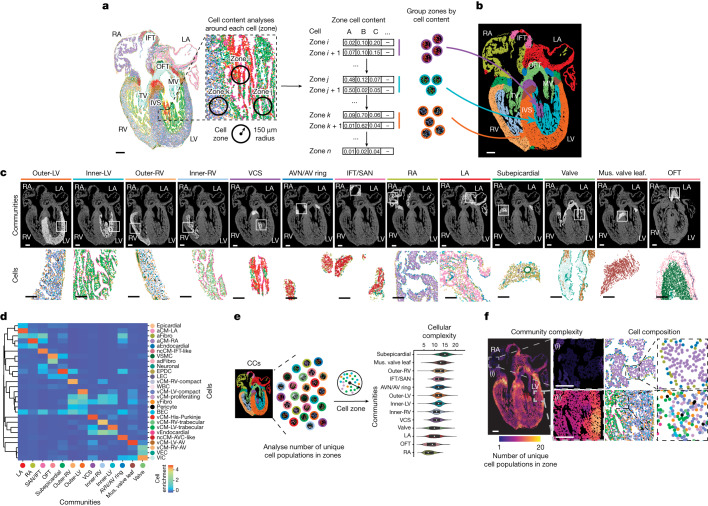
Fig. 2. Distinct cardiac cell populations spatially organize into CCs that form specialized cardiac structures.
a, Interrogation of the cell content around each individual cell identified cell zones or neighbourhoods, which formed defined CCs. b, Spatial mapping of CCs onto 13 p.c.w. hearts revealed their correspondence to distinct anatomical cardiac structures. c, The spatial location of each CC is displayed along with examples of their cellular composition and distribution (insets). d, Heatmap shows the composition of identified MERFISH cells within each defined CC. e,f, Analysis of the number of unique cell populations within each zone reveals the cellular complexity of each CC and cardiac region as displayed quantitatively (e, violin plot) and spatially (f, spatial complexity map). For e, the centre white dot represents the median, the bold black line represents the interquartile range, and the edges define minima and maxima of the distribution. Boxed areas in the spatial complexity map show regions of low (i) and high (ii) complexity. Insets (middle show the respective cellular composition, and magnified insets (right) show distinct identified cells). Mus. valve leaf., muscular valve leaflet. Scale bar, 250 µm (b,c,f).

