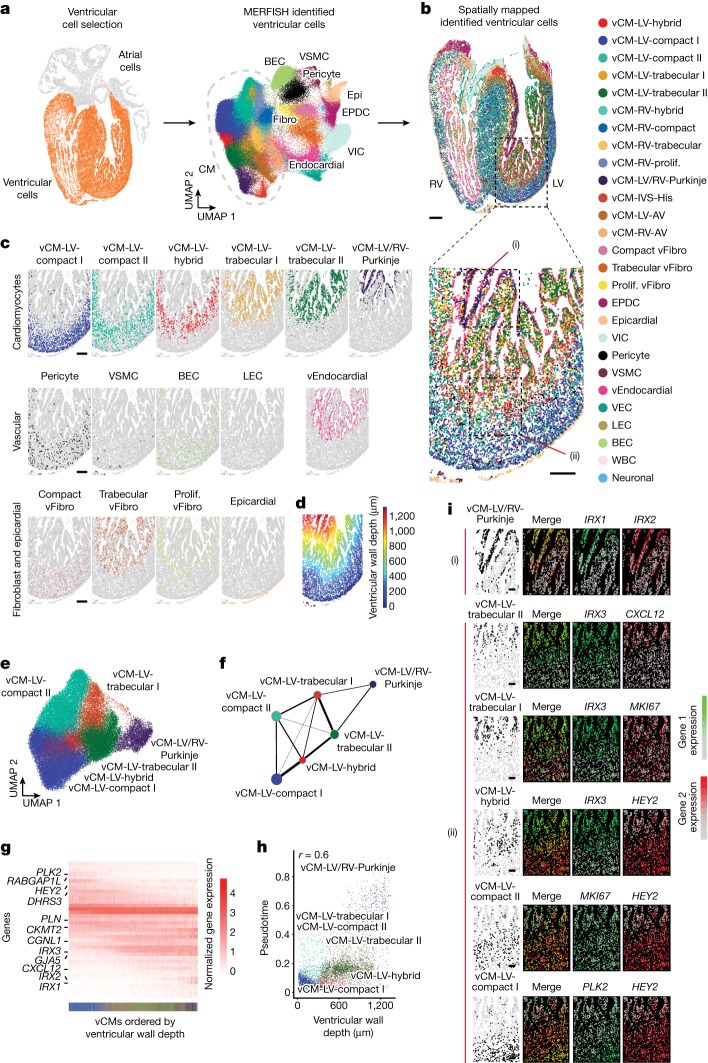
Fig. 3. The ventricular wall contains distinct specialized cardiac cells spatially organized into unexpected complex laminar layers.
a, MERFISH cells that constitute the ventricles (left, orange) were clustered as displayed using UMAP (right). b, Identified ventricular cells were spatially mapped in 13 p.c.w. ventricles. c, The spatial distributions of specific ventricular cells are shown for the left ventricular wall from the region outlined in the MERFISH spatial map in b. d, The ventricular wall depth distribution of ventricular cells is shown as a measured distance from the epicardial/outer surface of the ventricle for the imaged region in b. e, LV vCMs segregated into distinct vCM subpopulations. f, The molecular relationship of distinct vCMs is displayed in a connectivity map in which weighted edges between nodes represent their connectivity based on gene expression similarity. g, Heatmap shows the normalized expression of differentially expressed genes for vCMs as ordered by increasing ventricular wall depth. The coloured bar at the bottom indicates the specific vCMs as denoted in b. h, Scatter plot reveals the relationship between ventricular wall depth and pseudotime for individual vCMs in the left ventricle. i, MERFISH images of outlined regions in c ((i) and (ii)) show that specific combinations of gene markers, as shown in green and red, spatially identified specific vCMs. Scale bar, 250 µm.

