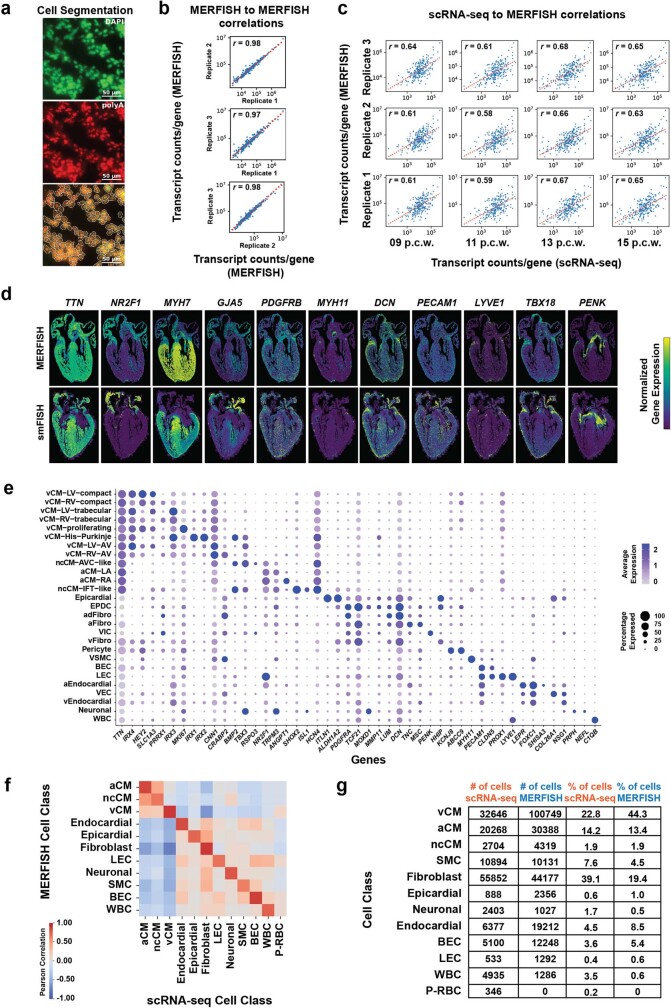
Extended Data Fig. 2. Quality control analyses of MERFISH data reveal its reproducibility and correspondence with scRNA-seq.
a, MERFISH cell boundaries were defined using CellPose74 with DAPI and polyA staining as input images. b, Pearson correlation of the counts of the 238 MERFISH target genes reveals strong correlation among the three replicate MERFISH experiments (Pearson correlation coefficient (r) > 0.95). c, Pearson correlation of the transcript counts of the 238 target genes shows that the 13 p.c.w. stage displays the highest average correlation (0.67 Pearson correlation) between the MERFISH and scRNA-seq datasets. d, MERFISH imaging was validated spatially by comparing normalized gene expression profiles of marker genes measured by single molecule FISH (smFISH) imaging with those detected by MERFISH imaging. e, Marker gene analysis identified each distinct MERFISH cell. f, Heatmap reveals that cell classes identified in the scRNA-seq dataset are detected in the MERFISH dataset, with the exception of P-RBCs. g, Table shows cellular composition similarities between the scRNA-seq and MERFISH datasets. aCM, atrial cardiomyocyte; aFibro, atrial fibroblast; adFibro, adventitial fibroblast; aEndocardial, atrial endocardial; AVC, atrioventricular canal; BEC, blood endothelial cell; CM, cardiomyocyte; EPDC, epicardial-derived cell; IFT, inflow tract; LA, left atrium; LEC, lymphatic endothelial cell; LV, left ventricle; ncCM, non-chambered cardiomyocyte; p.c.w., post conception weeks; P-RBC, platelet-red blood cell; RA, right atrium; RV, right ventricle; SMC, smooth muscle cell; vCM, ventricular cardiomyocyte; vCM-LV/RV-AV, muscular valve leaflet vCM; vEndocardial, ventricular endocardial; VEC, valve endocardial cell; vFibro, ventricular fibroblast; VIC, valve interstitial cell; VSMC, vascular smooth muscle cell; WBC, white blood cell. Scale bar, 50 µm.

