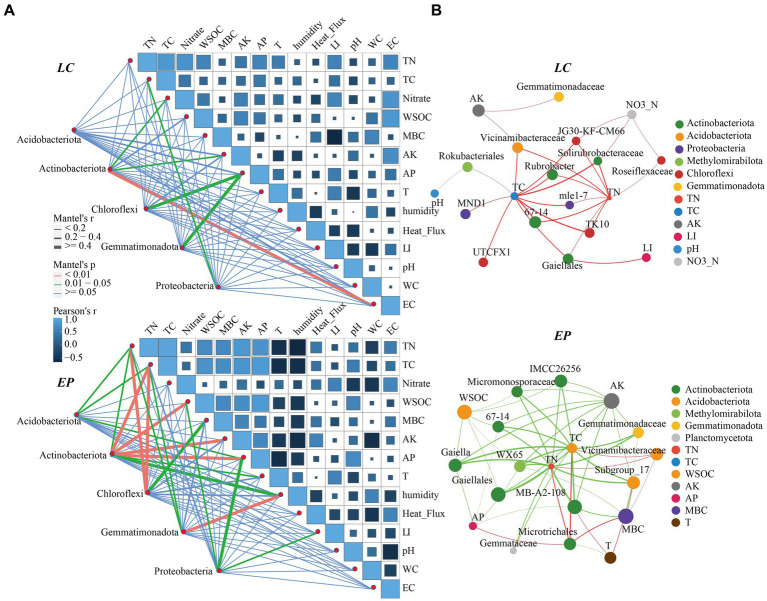
Figure 6.
(A) Correlation analysis and the Mantel test of soil properties and dominant SBCs in the genus LC and EP plots; (B) Two-factor correlation network analysis of core genera (Degree > 30) and environmental factors in the EP and LC plots; TC, total carbon; TN, total nitrogen; WSOC, water-soluble organic carbon; MBC, microbial carbon; AK, available potassium; AP, available phosphorus; EC, electric conductivity. LI, Light Intensity.

