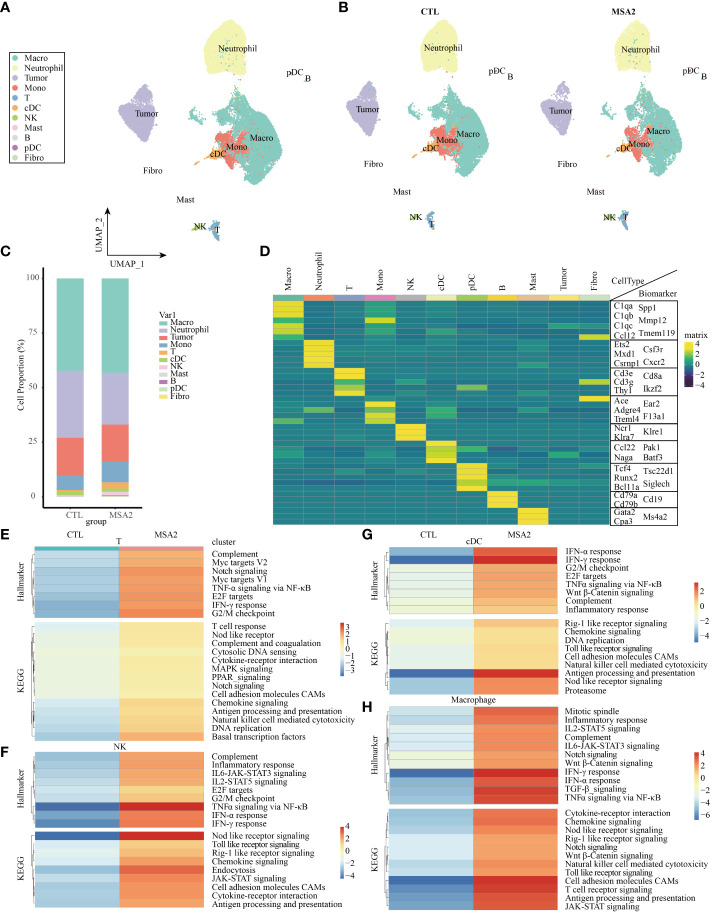
Figure 3.
The scRNA-seq analyses demonstrated the comprehensive immune landscape variations of TME after MSA-2 administration. (A) The cell clustering distribution of TME through secondary scRNA-seq analysis. (B) The alternations of cell distributions in TME of a breast cold tumor model between the control group (CTL) and MSA-2 treatment group. (C) The detailed cell proportions between CTL and MSA-2 treatment group. (D) The specific biomarkers of each component within TME. The signaling variations of T cells (E), NK cells (F), cDCs (G), and macrophages (H).

