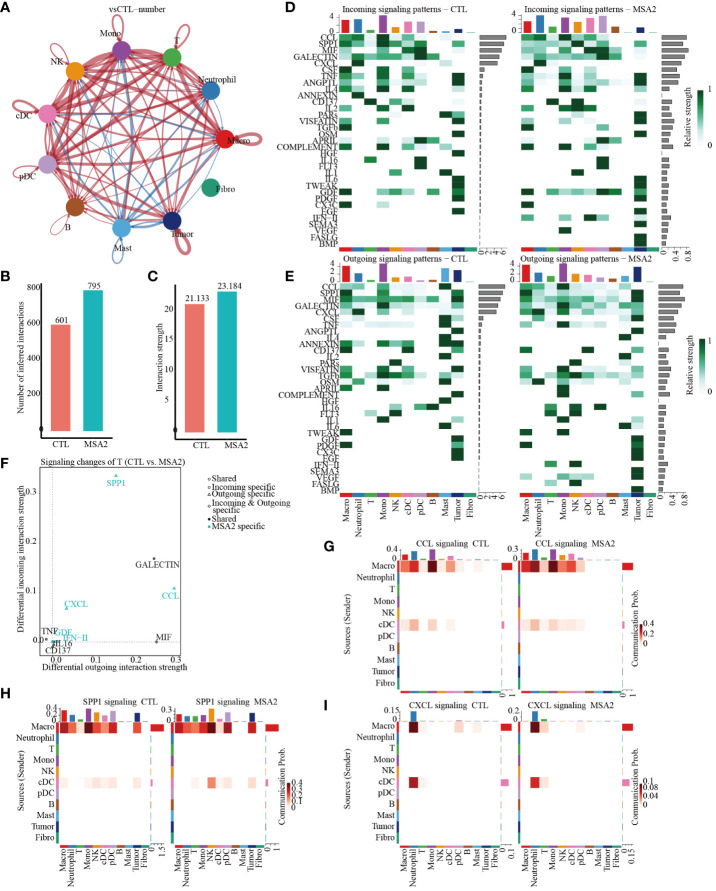
Figure 4.
The cellular interactions between components in TME through secondary analyses of scRNA-seq following MSA-2 utilized. (A) The size of the circles corresponds to the population size of the cell groups, while the thickness of the edges signifies the intensity of interaction between these populations. The red-colored loops were strengthened in the MSA-2 group, and the blue-colored loops were strengthened in the CTL group. (B) The bar plot demonstrates the disparity in quantification of cellular interactions between the CTL and MSA-2 groups. (C) Bar plot depicts the discrepancies in the strength of interaction among TME components. (D) Heatmaps indicate the strength of incoming signaling patterns of components of the TME. (E) Heatmaps indicate the strength of outcoming signaling patterns of components of the TME. (F) Volcano plot depicts the most significant signaling in the context of both incoming and outcoming signaling. Heatmaps illustrate the disparities in communication probability among TME cells between the CTL group and MSA2 group in relation to CCL signaling (G), SPP1 signaling (H), and CXCL signaling (I).

