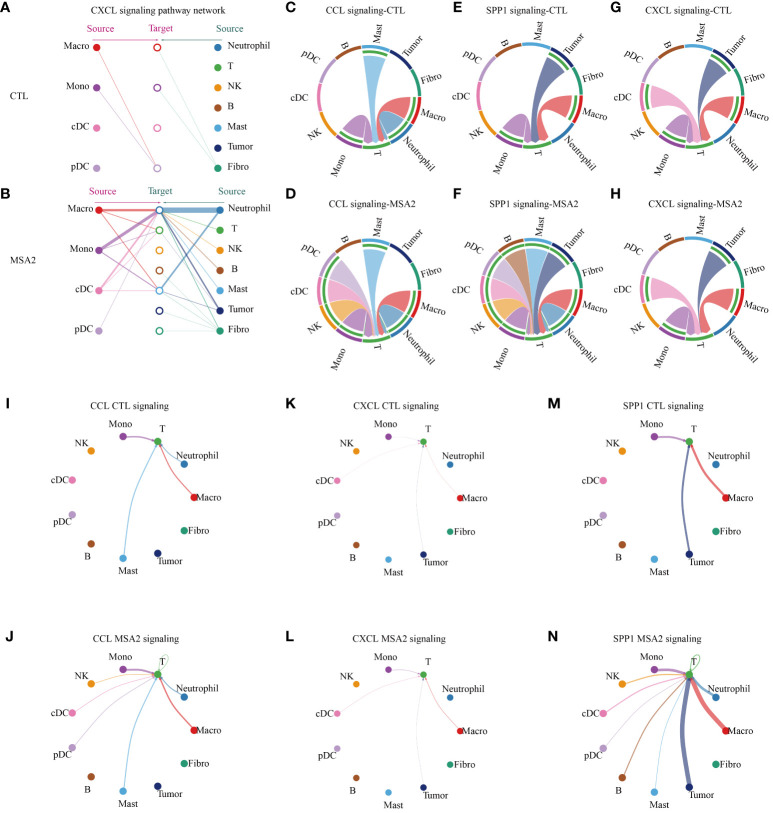
Figure 5.
The cellular interactions between components in TME. In the CXCL signaling pattern, the interaction between antigen presenting cells (macrophage, monocytes, cDC and pDC) and other components in TME of CTL group (A) or MSA2 group (B). (C–H) The plots illuminate, in each intriguing signaling pattern, the intercellular interactions circled T cells. (I–N) The plots indicate, in the realms of each interesting signaling, the interaction strength of each cellular communication centered on T cells. The thickness of each line infers the interaction strength.

