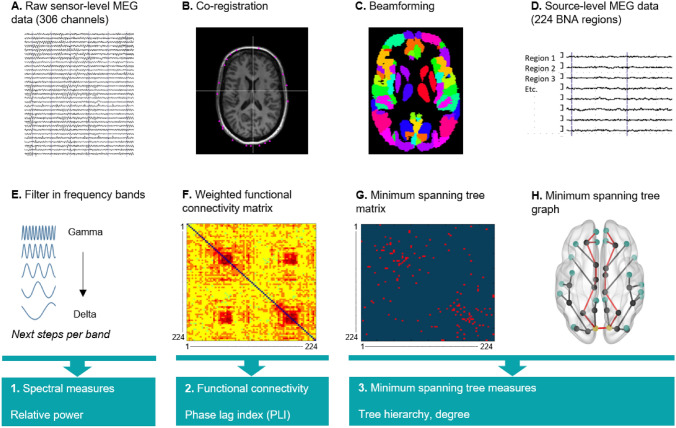
Fig. 2.
MEG pre-processing steps. A Raw MEG recording at sensor level, where each trace represents one MEG channel. Vertical lines mark 1 s segments of data. B The MEG recording was co-registered to a surface-matched structural MRI template. C Beamforming was applied to convert the MEG signal to source space: signals were projected onto the Brainnetome (BNA) atlas. D Each MEG signal corresponds to the centroid of one BNA region (i.e., source level). E Data were filtered into six frequency band, and each of the following steps was calculated for each frequency band. F The phase lag index (PLI) was calculated between each of 224 regions of the BNA atlas. G The Minimum Spanning Tree (MST) was constructed based on the PLI, which consists of the 223 strongest connections. These connections were subsequently binarized. H An example of an MST graph. MEG magnetoencephalography, BNA Brainnetome

