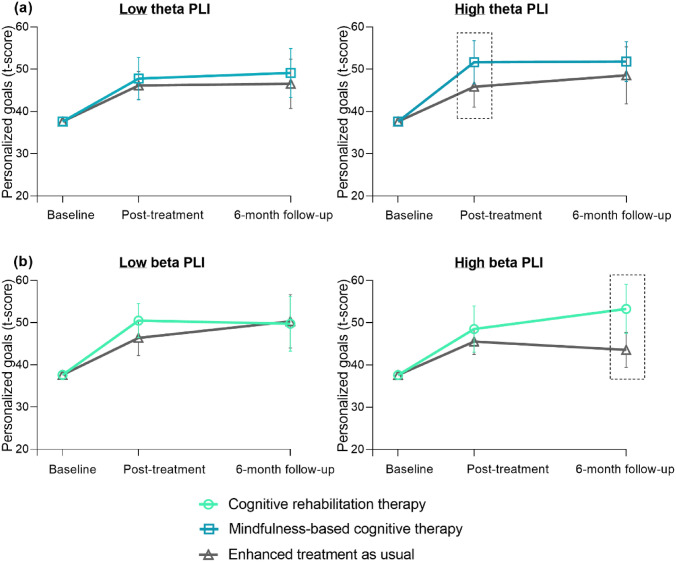
Fig. 4.
Visualization of MEG treatment predictors on personalized goals. Treatment response is visualized in patients with low and high baseline values (using a median split) of significant MEG predictors. The dotted rectangles highlight the treatment effects predicted by MEG measures. a Response on personalized goals visualized in patients with low theta PLI (left) and high theta PLI (right) at baseline. b Response on personalized goals visualized in patients with low beta PLI (left) and high beta PLI (right) at baseline, the same pattern was found in the default mode network. PLI phase lag index; DMN default mode network

