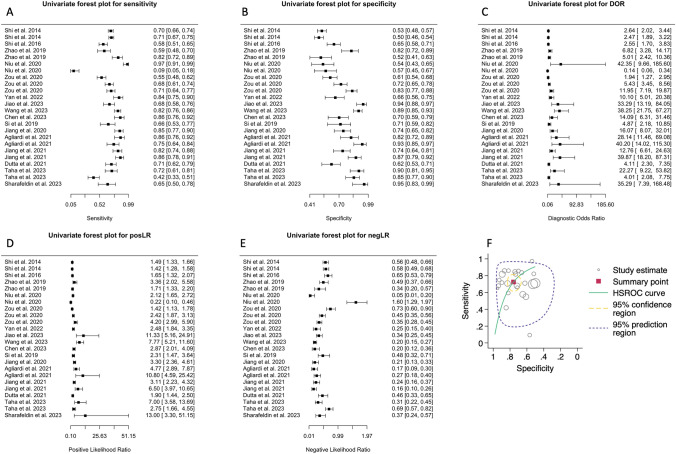
Fig. 2.
Diagnostic accuracy of biomarkers in speculative CNS-enriched EVs for the differential diagnosis of Parkinson’s disease (PD) from healthy controls (HCs). A-E Univariate Forest plots for sensitivity, specificity, diagnostic odds ratio (DOR), positive (posLR) and negative (negLR) likelihood ratios, respectively. F Summary receiver operating characteristics (SROC). The dotted circle shows the mean summary estimate of sensitivities and specificities using a bivariate model. The summary line is obtained from a hierarchical SROC model. CNS central nervous system; EVs extracellular vesicles

