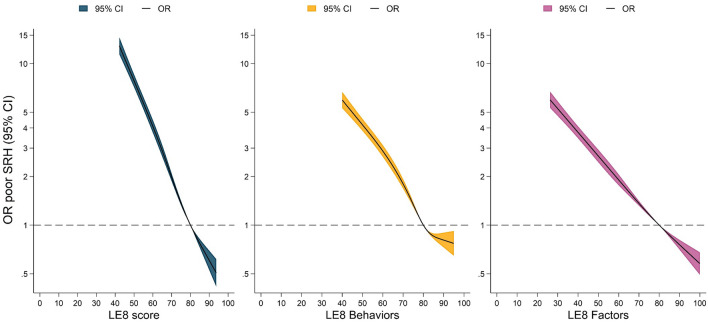
Fig. 2.
Restricted cubic splines for the association of Life’s Essential 8, Life’s Essential 8 behavior, and Life’s Essential 8 factor scores with poor self-rated health. All models are binary logistic regressions adjusted by age, sex, and site. X-axes were trimmed to depict the associations for the 1st to 99th percentile of LE8 values. Reference points are settled at 80 points, which represent the 78.2th, 58.7th, and 76.1th percentiles for LE8, LE8 behaviors, and LE8 factors, respectively. CI confidence interval, OR odds ratio, LE8 Life’s Essential 8 score, SRH self-rated health

