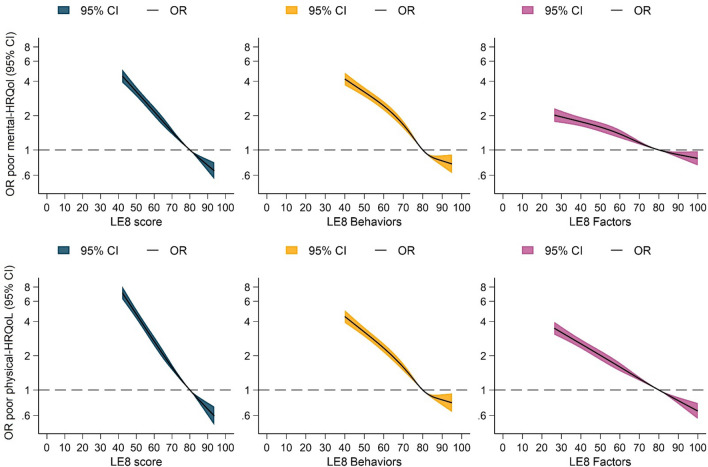
Fig. 3.
Restricted cubic splines for the association of Life’s Essential 8, Life’s Essential 8 behavior, and Life’s Essential 8 factor scores with poor mental health-related quality of life (upper row) and poor physical health-related quality of life (lower row). All models are binary logistic regressions adjusted by age, sex, and site. Reference points are settled at 80 points. X-axes were trimmed to depict the associations for the 1st to 99th percentile of LE8 values. CI confidence interval, OR odds ratio, LE8 Life’s Essential 8 score, HRQoL health-related quality of life

