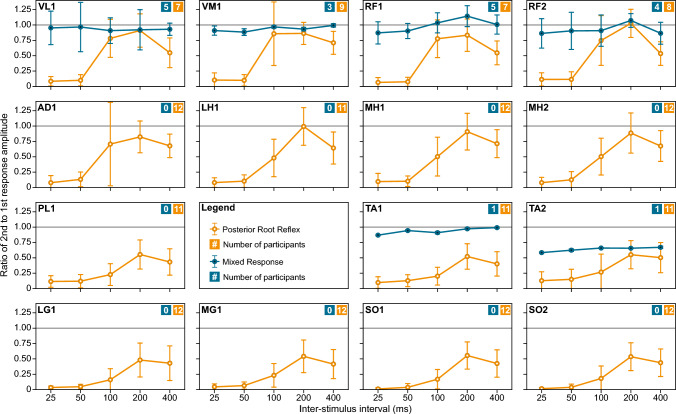
Fig. 3.
Paired-pulse profiles of posterior root reflexes and mixed responses in 12 participants. The group means (circles) and standard deviations (error bars) of the paired-pulse ratios for reflexes (orange) and mixed responses (blue) recorded in UPS1 are shown for different muscles and interstimulus intervals. The number of participants contributing to each type of response is indicated in the top right corner of each panel. Muscle abbreviations as in Fig. 2

