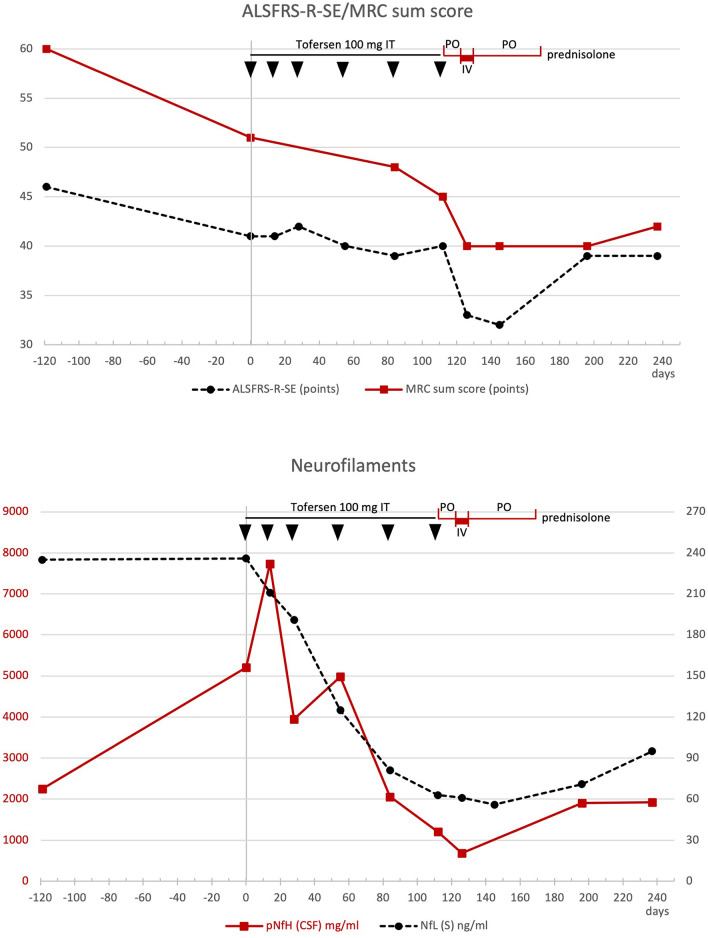
Fig. 3.
(top) Values of the ALSFRS-R-SE (dashed black line) and the MRC sum score (red line) within the clinical course. (bottom) Values of the neurofilaments (CSF-pNfH in red, serum NfL in dashed black line) over time. Also shown in the footer are the results of oligoclonal bands (OCB) in CSF/serum with detection of CSF-specific OCB on days 112, 145, and 196. Tofersen was administered intrathecally (IT) at time points days 1 (vertical gray line), 14, 28, 55, 84, and 112 (black arrows). The administration of prednisolone during the period from days 116 to 172 is shown in red on the time line at the top of the graphs (po = oral; iv = intravenous)

