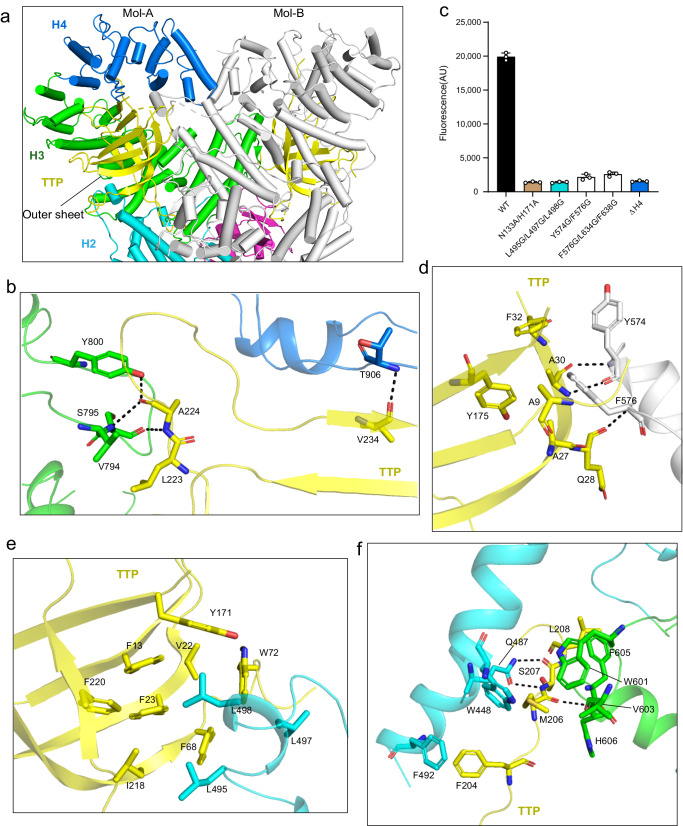
Fig. 4. Interactions between DSR2 and TTP proteins.
a Close-up view of the interactions between the BS1 domain of TTP protein and DSR2 proteins. The same color scheme as in Fig. 1a is used for the DSR2-A molecule. The DSR2-B molecule is colored in gray and the bound TTP is colored in yellow. b Detailed insights into the interactions between TTP and the H3-4 subdomains of DSR2. Key interacting residues are shown in stick representation. c In vitro NAD+ cleavage assay using WT or mutants of DSR2 protein. Mutations of the key residues in DSR2-TTP binding interface remarkably reduced NAD+ consumption. All experiments were replicated at least three times (mean ± SD, n = 3 independent replicates). d Detailed insights into the interactions between TTP and the H3 subdomain of DSR2-B. Key interacting residues in this interface are shown as sticks. e Detailed insights into the interactions between TTP and the H2 subdomain of DSR2. Key residues involved in the hydrophobic interaction between TTP and the H2 subdomain of DSR2 are shown in stick representation. f Close-up view of the interactions between the TTP and the H2-3 subdomains of DSR2. Key interacting residues are shown in stick representation.

