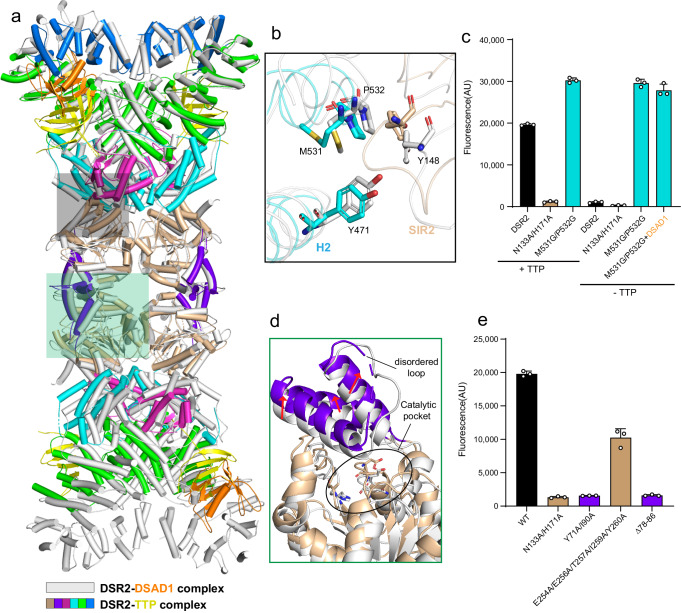
Fig. 5. The molecular basis of DSR2 activation by TTP protein.
a Structural comparison between the DSR2-TTP complex and DSR2-DSAD1 complex. In the structure of the DSR2-DSAD1 complex, the DSR2 and DSAD1 are colored in gray and orange. The color scheme for the DSR2-TTP complex is consistent with that in Fig. 3d. b Close-up view of the inter-domain interaction between the H2 subdomain and SIR2 domain. c In vitro NAD+ degradation assay of WT and mutant DSR2 proteins in the presence or absence of TTP. The NADase activity of DSR2 was self-activated through mutations of key residues in the H2-SIR2 interface. All experiments were replicated at least three times (mean ± SD, n = 3 independent replicates). d Compared to the structure of DSR2 in the DSAD1-binding state, the lid region of the SIR2 domain undergoes conformational changes in the TTP-binding state, leading to outward movement and flexibility in the lid region, thus exposing the catalytic pocket (marked with a black circle). e In vitro NAD+ degradation assays investigating the impact of lid region mutations on the NADase activity of DSR2. All experiments were replicated at least three times (mean ± SD, n = 3 independent replicates).

