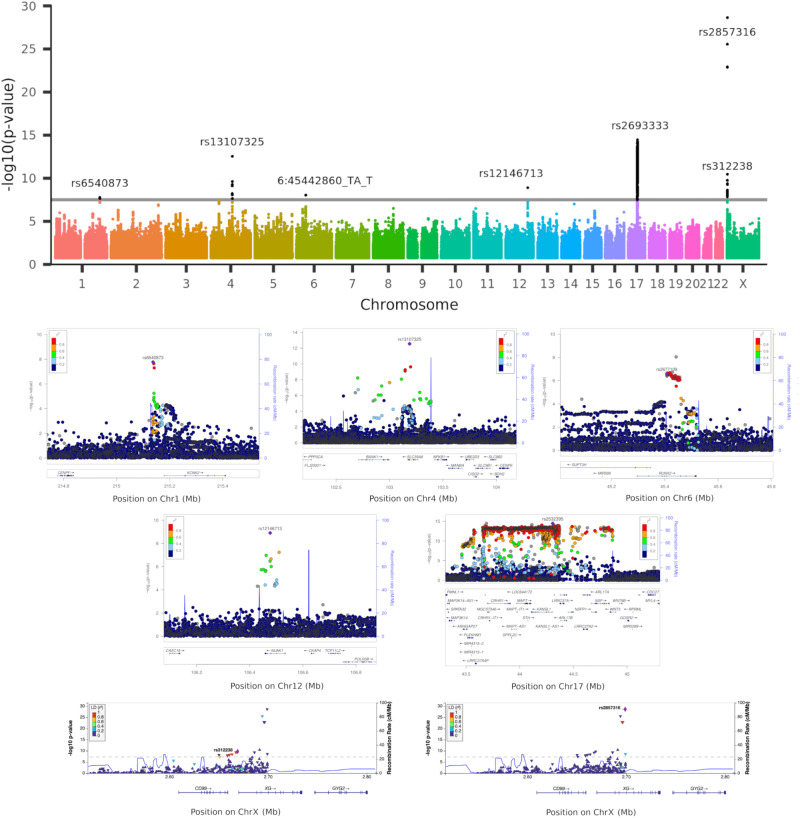
Fig. 2. Manhattan plot and regional autosomal association plots for the variants significantly associated genome-wide with the vulnerable ‘last in, first out’ (LIFO) brain network.
Top row, Manhattan plot showing the 7 significant genetic clusters associated with the LIFO brain network (–log10(P) > 7.5). Second and third rows, regional association plots of the top variants for each of the 5 autosomal genetic clusters: rs6540873 on chromosome (Chr) 1 (KCNK2), rs13107325 on Chr4 (SLC39A8), rs2677109 on Chr6 (RUNX2) (as a proxy in high LD R2 = 0.86 with indel 6:45442860_TA_T), rs12146713 on Chr12 (NUAK1), and rs2532395 on Chr17 (MAPT, KANSL1)(highest variant after tri-allelic rs2693333; see Supplementary Data 4 for a complete list of significant variants in this 5th MAPT genetic cluster). Bottom row, regional association plots of the top variants for the two genetic clusters in the pseudo-autosomal region PAR1 of the X chromosome: rs312238 (XG, CD99) and rs2857316 (XG)(UK Biobank has no genotyped variants on the 3’ side). Based on Human Genome build hg19. P-values are derived from a two-sided linear association test.

