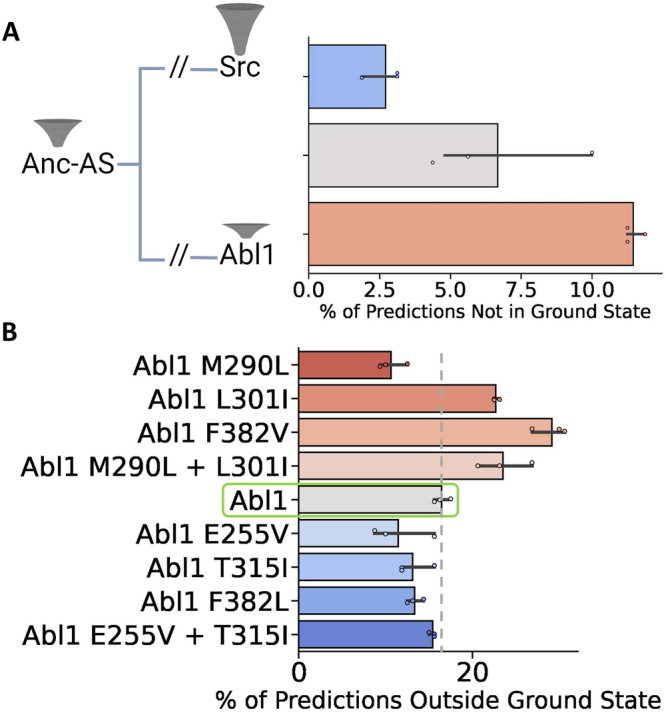
Fig. 6. Subsampled AF2 predictions of the percent of conformations not in the ground state for proteins along the Src to Abl1 evolutionary pathway and Abl1 resistance-causing mutations.

A Representation of the evolutionary history connecting Abl1, Anc-As, and Src, and the relative population of the ground state for each kinase core26. Right: Percentage of predictions that fall outside of the ground state for each test case. B Results of subsampled AF2 for the Abl1 kinase domain allelic series. Data are colored based on the expected relative state populations of each mutation: red-tinted bars represent mutations that are known to decrease the ground state population, while blue-tinted bars represent mutations with the opposite effect23. Data are presented as mean values +/− standard error of the mean, and were calculated from three independent sets of predictions, each with 32 unique seeds and 5 models, totaling 160 predictions per replicate. Source data are provided as a Source Data file. Figure Created with BioRender.com.
