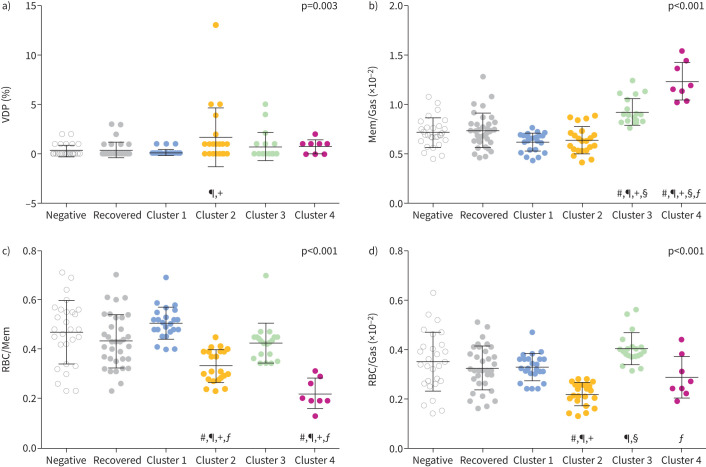
FIGURE 3.
Magnetic resonance imaging (MRI) measurement comparison by cluster. Comparison of four MRI measurements used to generate long COVID clusters against COVID-negative and fully recovered participants for a) ventilation defect percent (VDP), b) membrane-to-gas (Mem/Gas) ratio (membrane uptake), c) red blood cell-to-membrane (RBC/Mem) ratio and d) red blood cell-to-gas (RBC/Gas) ratio (red blood cell transfer). Symbols signify significant differences (p<0.05): #: versus COVID-negative; ¶: versus recovered; +: versus Cluster 1; §: versus Cluster 2; ƒ: versus Cluster 3.

