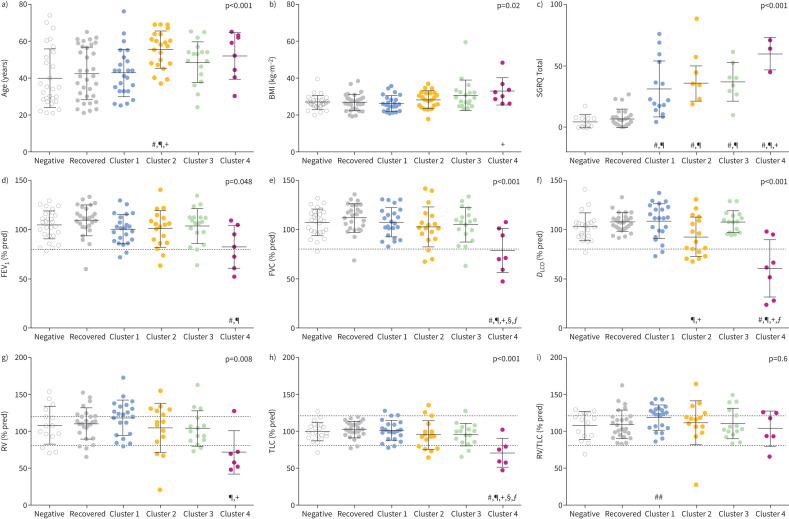
FIGURE 4.
Demographic and pulmonary function test (PFT) measurement comparison by cluster. Comparison of clinical characteristics across COVID-negative, recovered and long COVID clusters for a) participant age, b) body mass index (BMI), c) St George's Respiratory Questionnaire (SGRQ) Total score, d) forced expiratory volume in 1 s (FEV1), e) forced vital capacity (FVC), f) diffusing capacity of the lung for carbon monoxide (DLCO), g) residual volume (RV), h) total lung capacity (TLC) and i) RV/TLC. Dotted grey lines show lower and/or upper limits of normal for PFTs. p-values in graphs are from ANOVA comparing all six groups. Symbols signify significant group-wise differences after Bonferroni correction (p<0.05): #: versus COVID-negative; ¶: versus recovered; +: versus Cluster 1; §: versus Cluster 2; ƒ: versus Cluster 3. ##: as a proof-of-concept using an independent samples t-test, Cluster 1 RV/TLC was significantly greater than COVID-negative (p=0.04).

