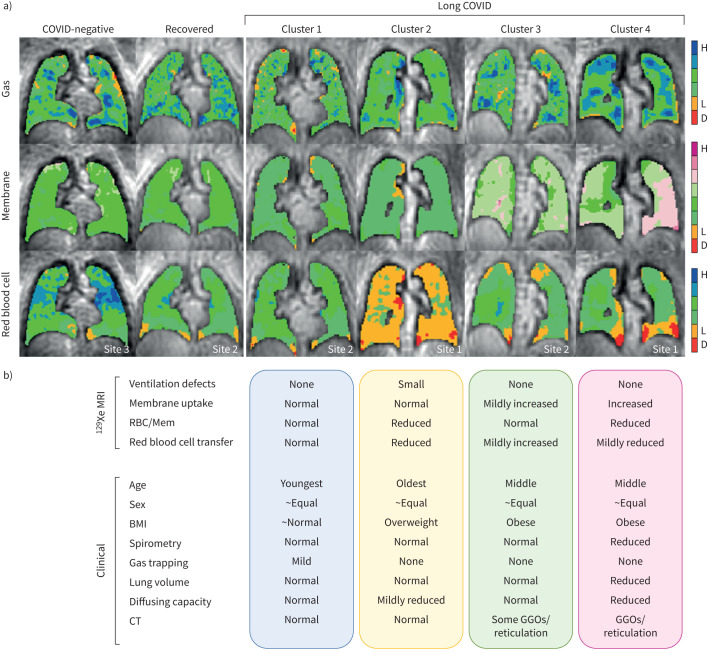
FIGURE 5.
Long COVID cluster summary. a) 129Xe magnetic resonance gas, membrane and red blood cell images for representative participants in the COVID-negative group, the recovered group and resulting long COVID clusters. The site location for each participant is embedded in the images. b) Qualitative cluster comparison for imaging measurements used to generate clusters and clinical characteristics. D: defect (no signal); L: low-intensity signal; H: high-intensity signal; RBC/Mem: red blood cell-to-membrane ratio; BMI: body mass index; CT: computed tomography; GGO: ground-glass opacity.

