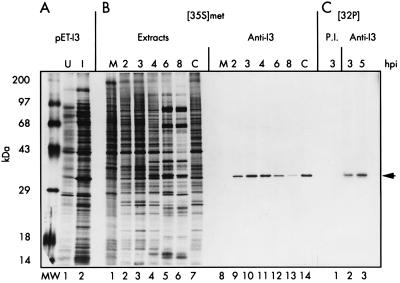
FIG. 1.
Analysis of I3 expression in E. coli and in vaccinia virus-infected cells. (A) Synthesis of recombinant I3 in E. coli transformants containing plasmid pET-I3. Extracts from uninduced (U) or induced (I) bacteria are shown in lanes 1 and 2, respectively; the 34-kDa I3 protein is apparent in induced extracts. Cultures were metabolically labeled with [35S]methionine as described in Materials and Methods prior to being harvested and analyzed by SDS-PAGE and fluorography. (B) Temporal profile of I3 synthesis. Parallel cultures were left uninfected (M), infected with wt vaccinia virus (MOI of 15), and harvested at 2, 3, 4, 6, or 8 hpi or were infected with wt vaccinia virus (MOI of 15) in the presence of cytosine arabinoside and harvested at 4 hpi (C). Cells were metabolically labeled with [35S]methionine for 45 min prior to being harvested. Aliquots of total cellular lysates (lanes 1 to 7) as well as the species recovered after immunoprecipitation with anti-I3 serum (lanes 8 to 14) were analyzed by SDS-PAGE and fluorography. (C) I3 is phosphorylated in vivo. Cells infected with wt vaccinia virus (MOI of 15) were metabolically labeled with 32Pi from 1 to 3 or 3 to 5 hpi and harvested at the end of the labeling period. The time of harvest is shown above the lanes. Lysates were subjected to immunoprecipitation with preimmune serum (P.I.) or anti-I3 serum and subjected to SDS-PAGE and fluorography. 14C-labeled protein standards are shown at the far left in the lane marked MW, with their molecular masses indicated. The arrow at the far right shows the position of electrophoretic migration of both recombinant and authentic I3 protein.

