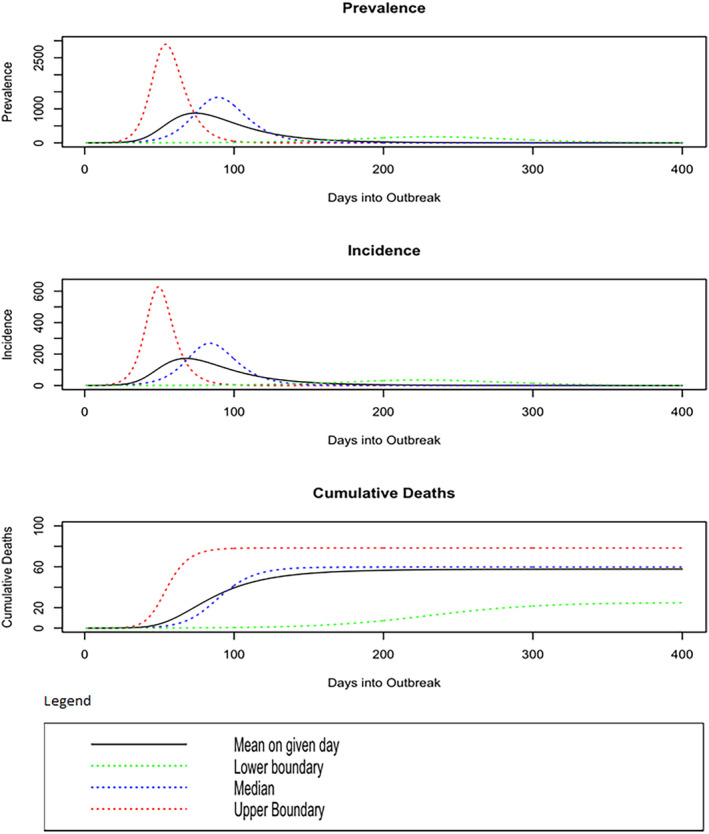
FIGURE 4.

Estimates of the prevalence, incidence, and cumulative deaths over time had mitigation not occurred. The lower/upper boundaries are the 2.5%/97.5% probability events. The difference between the mean and median outcomes reflects the skewness of the distributions.
