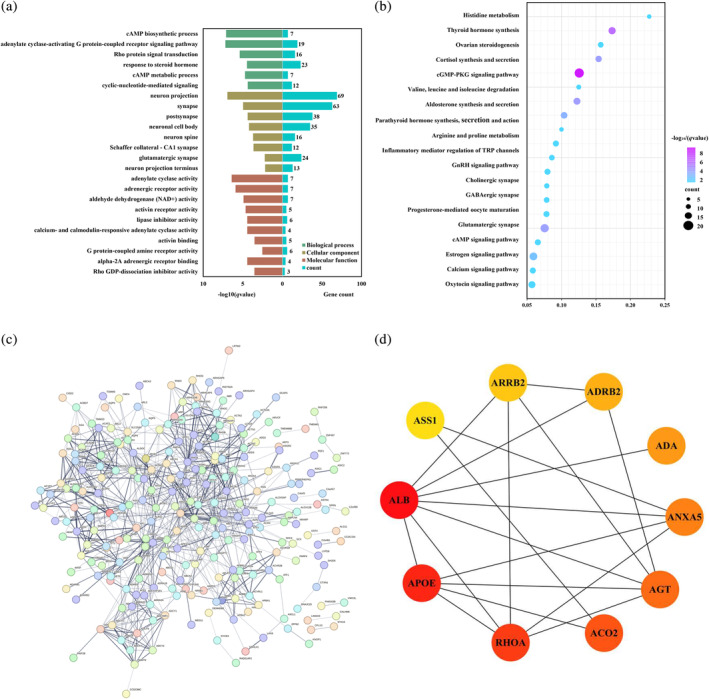
FIGURE 4.

Gene enrichment analysis and the corresponding PPI network of the genes for PPD derived from spatial association analyses between transcriptome and changes of FCs. (a) Triplicate histograms were plotted for GO enrichment analysis of biological processes (BP), cellular component (CC), and molecular functions (MF). All the results were obtained with p < 0.05 (BH‐FDR correction). (b) Bubble plot was used to show the KEGG enrichment analysis results obtained with p < 0.05 (BH‐FDR correction). (c) A PPI network was constructed using significantly associated genes with changes of FCs. (d) The top 10 hub genes of the PPI network were shown and different colors represent the size of degree (The dark red represents higher degree values and the yellow represent lower degree values).
