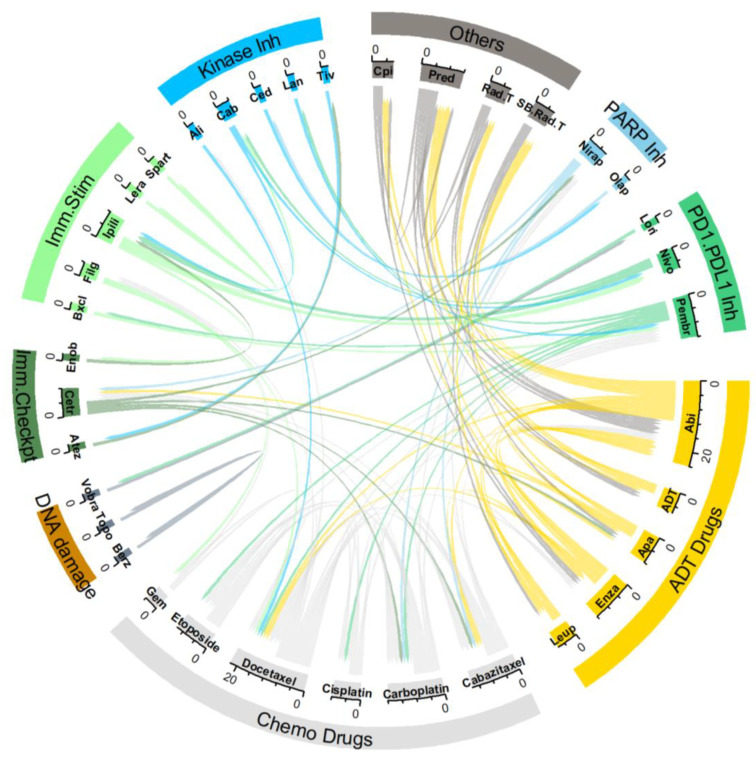
Figure 2.
Circos plot of drug combinations in clinical trials for NEPC. The drugs are classified into broad groups based on their expected functions and linked based on combination use in a clinical trial. Each drug pair has both an outgoing and incoming link. Outgoing links are depicted with a flat end while incoming links are depicted with arrows that terminate earlier. Data used to create the plot (including drug abbreviations) are in Supplementary Table S1.

