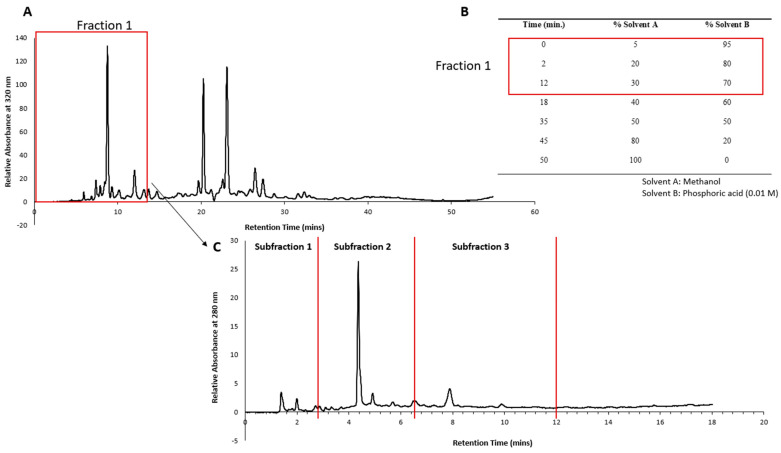
Figure 9.
(A) Chromatogram of Pittosporum angustifolium extract showing retention times at which Fraction 1 was collected. (B) Elution gradient of P. angustifolium extract fractionation. (C) HPLC chromatogram of P. angustifolium Fraction 1 and the retention times (0–3 min (Subfraction 1), 3–6 min (Subfraction 2) and 6–11 min (Subfraction 3)) at which the three subfractions were collected.

