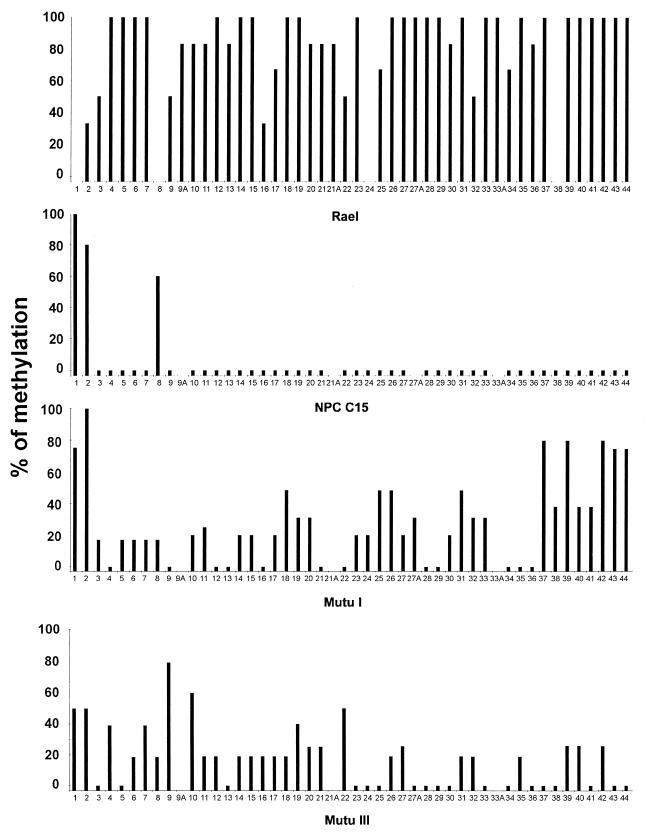
FIG. 3.
A summary of the bisulfite genomic sequencing of the LRS region. The y axis shows the percentage of methylation in all clones analyzed at this CpG site. The x axis shows the individual CpG sites in the LMP-1 promoter region and the 5′ region of the exon analyzed. Each bar represents one CpG site. A small bar below the zero level indicates that the CpG site is present and unmethylated. A CpG site with no bar on top shows that the site is not present in the isolate. A, additional CpG sites (for details, see the legend to Fig. 2). Three to six individual clones for each CpG site in bisulfite-treated Rael DNA were analyzed. Five NPC C15 clones were analyzed at each individual CpG site. Two to six clones from the Mutu I and III cell lines were analyzed.

