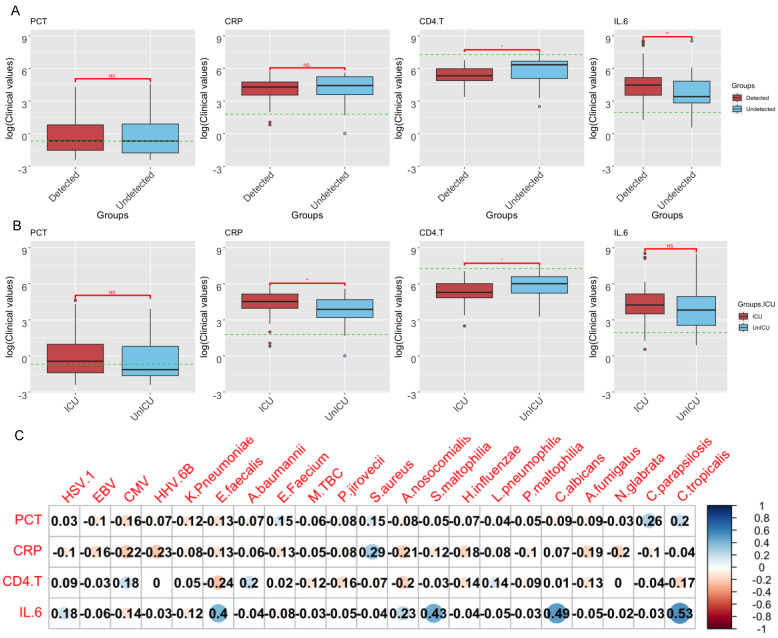
Figure 6.
Association between clinical factors and the abundance levels of pathogenic microbes. (A) The correlation between four clinical indicators and the SARS-CoV-2 detection status. The green dashed lines represent the threshold for each clinical indicator. The statistical significance of comparisons (Wilcoxon test) is marked on top of the boxplot: * (p < 0.05); ** (p < 0.01). (B) The correlation between four clinical indicators and disease severity (i.e., whether the patient stayed in the ICU), with the same threshold line and statistically significant differences in (A). (C) Correlation heatmap between four clinical indicators and pathogenic microbiomes by the order of virus, bacteria, and fungus.

