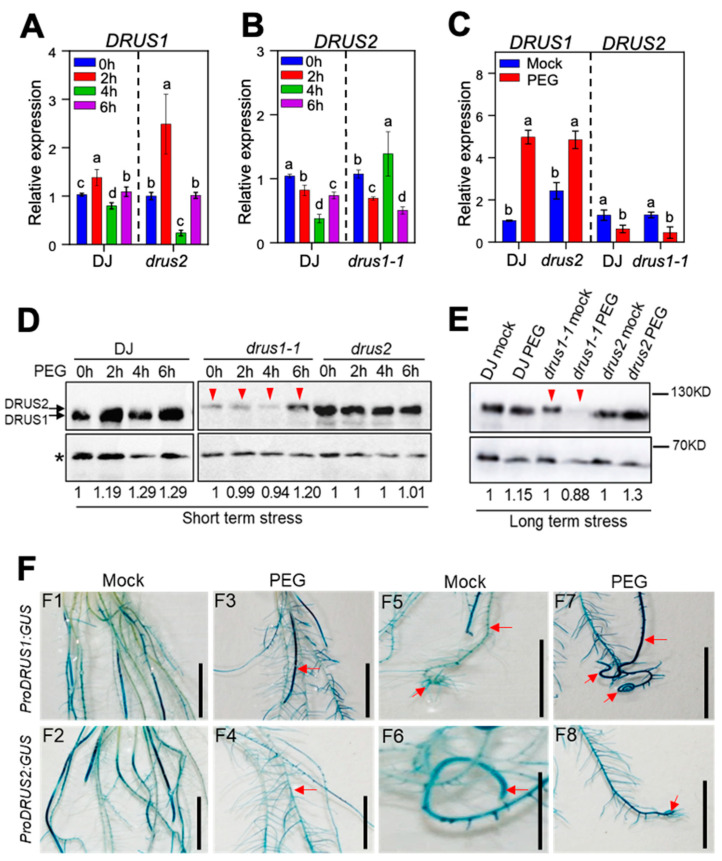
Figure 4.
The expression of DRUS1 and DRUS2 in roots in response to osmotic stress (15% PEG). (A,B) The effects of short-term OS on DRUS1 (A) and DRUS2 (B) mRNA levels. Two-week-old seedlings treated with PEG for the indicated hours were used to detect mRNA via qRT-PCR. The mRNA level of 0 h in DJ was set to 1. (C) The effects of long-term OS on DRUS1 and DRUS2 mRNA levels. Seedlings of 3 DAG, treated with PEG or mock for two-weeks, were used to detect mRNA via qRT-PCR. The mRNA level in DJ mock was set to 1. OsActin was used as an internal control. Three biological replicates were included for each treatment. a, b, c, and d indicated the significant differences via a one-way ANOVA, where p < 0.05. (D,E) Protein levels of DRUS1 and DRUS2 in roots for short- (D) and long-term (E) osmotic stress. An asterisk marks the non-specific band, while arrows indicate the specific band. Numbers indicate the protein level relative to 0 h stress in DJ, drus1-1, and drus2 mutants after normalizing to a non-specific band. (F) Promoter activity analysis of DRUS1 and DRUS2 using ProDRUS1:GUS and ProDRUS2:GUS reporter transgenic plants. Seedlings of 3 DAG, with and without osmotic stress for 14 days, were used for GUS staining. Bar = 1.5 cm. Arrows indicate enhanced or repressed staining.

