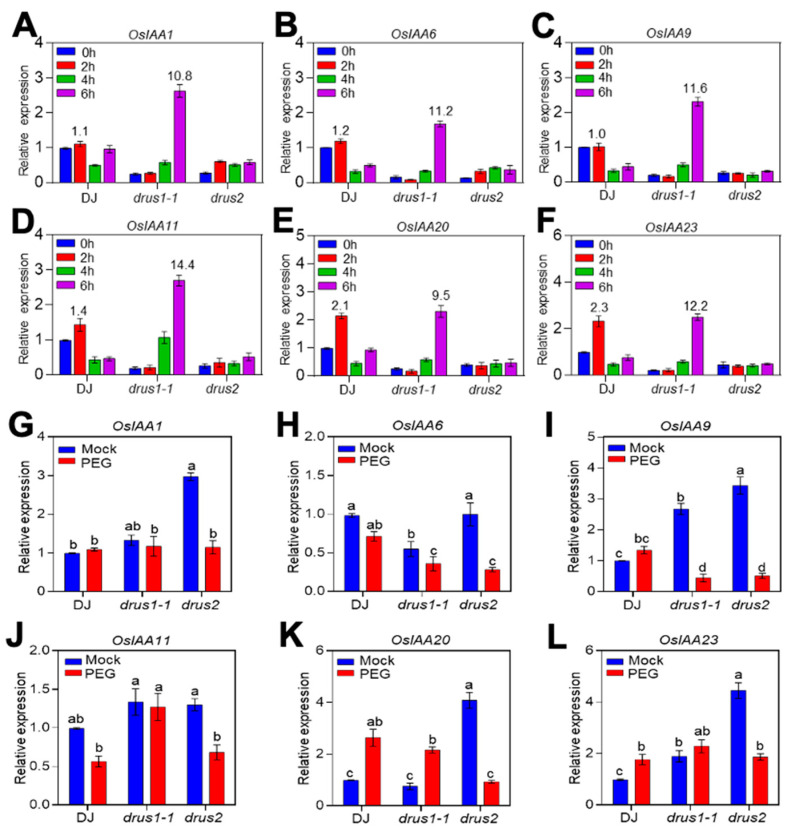
Figure 8.
Identification of auxin signaling repressors (OsIAAs) in response to OS via RT-qPCR. (A–F) Seedlings of 14-DAG with short-term OS treatment were used to compare the relative mRNA levels of six OsIAAs in the roots. The greater change folds compared to each mock are mentioned on top of the column. (G–L) Seedlings of 3 DAG with OS treatment for another 14 days were used to compare the relative mRNA level of six OsIAAs in the roots. OsActin was used as an internal control. The transcript levels in DJ at 0 h (A–F) or mock (G–L) were set to 1. On top of the pictures are the names of the genes. The experiment was carried out three times and is presented as the mean ± SD of three biological replicates. a, b, c, and d specify significant differences obtained via two-way ANOVA (Tukey’s test), where p < 0.05.

