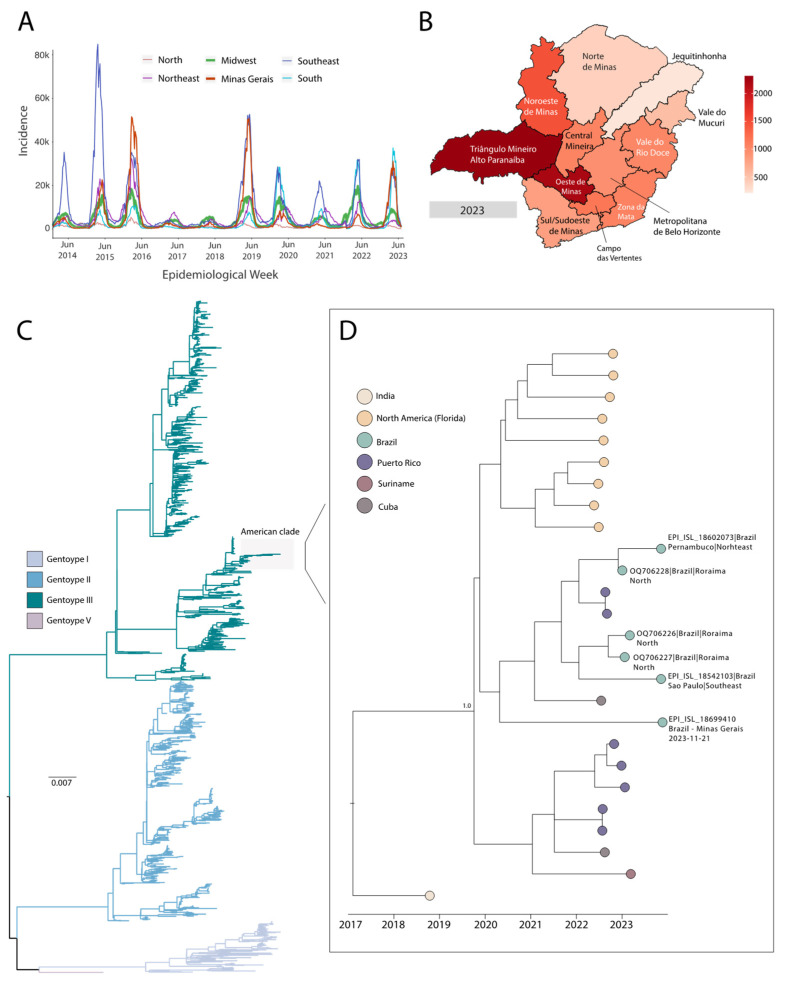
Figure 1.
Genomic epidemiology of dengue in Minas Gerais, Brazil. (A) Weekly notified dengue cases normalized per 100,000 individuals per Brazilian macro region (North, Midwest, Southeast, Northeast, and South) during 2014–2023 (up to June 2023). Data from the state of Minas Gerais were plotted separately (outside the Southeast macro region) for better visualization. Epidemic curves are colored according to geographical region. (B) Weekly notified dengue cases from Minas Gerais state (normalized per 100,000 individuals) divided by health mesoregion during 2023 (up to June 2023). (C) Midpoint rooted maximum-likelihood phylogeny of DENV-3 isolates (n = 1702), showing distinct genotypes. The scale bar is in units of substitutions per site (s/s). (D) Time-resolved maximum-likelihood tree showing the clade containing our newly generated DENV-3 III sequence from Minas Gerais State, Brazil. Colors represent different sampling locations.

