
FIGURE 4.
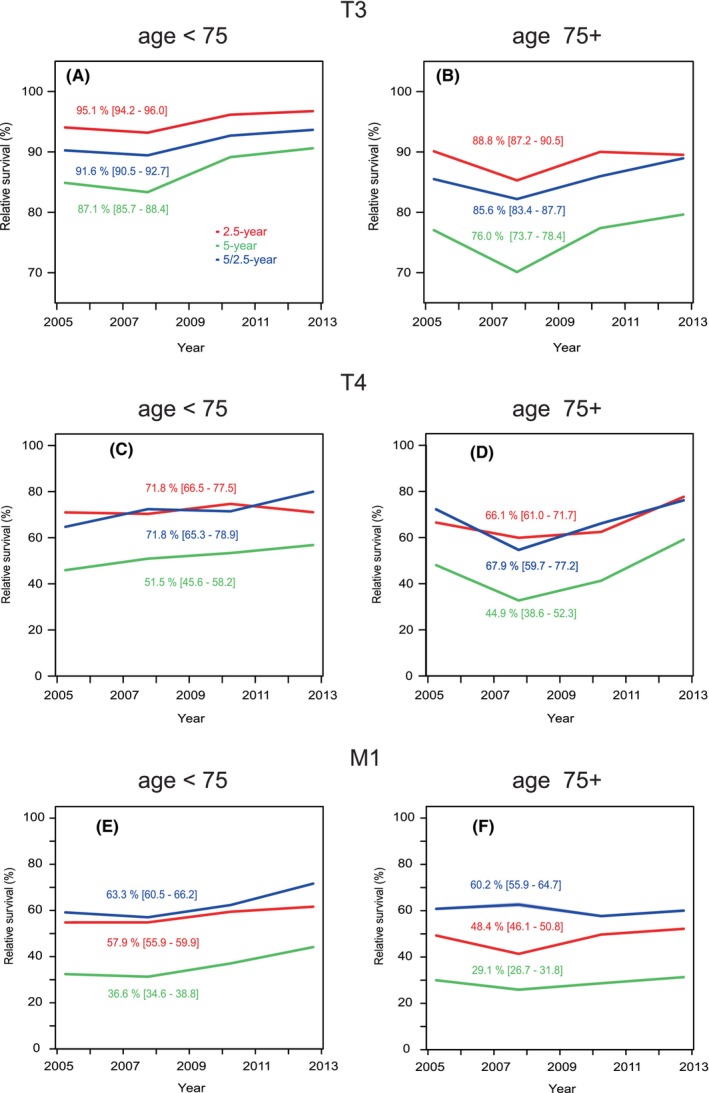
Relative 2.5‐, 5‐ and 5/2.5‐year survival % in prostate cancer in Sweden in stages T3 (A, B), T4 (C, D) and M1 (E), F9 in age‐groups <75 (on the left) and 75+ (on the right).
Official websites use .gov
A
.gov website belongs to an official
government organization in the United States.
Secure .gov websites use HTTPS
A lock (
) or https:// means you've safely
connected to the .gov website. Share sensitive
information only on official, secure websites.
Relative 2.5‐, 5‐ and 5/2.5‐year survival % in prostate cancer in Sweden in stages T3 (A, B), T4 (C, D) and M1 (E), F9 in age‐groups <75 (on the left) and 75+ (on the right).