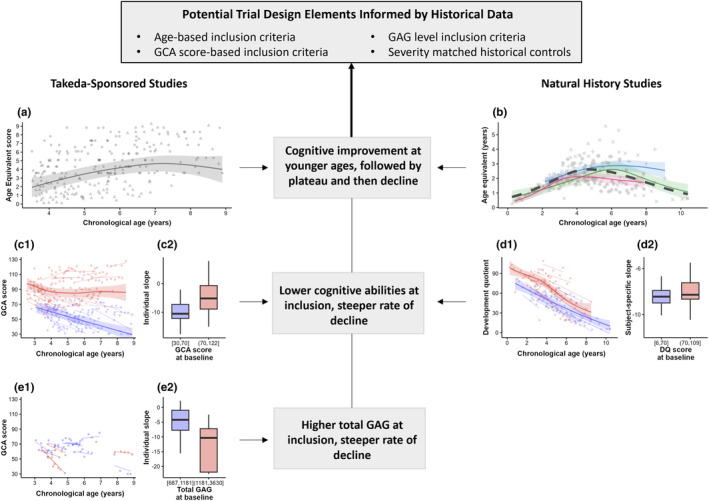
FIGURE 2.

Cognitive abilities across chronological age for Takeda‐sponsored studies (left column) and natural history studies (right column). Panels (a) and (b): Age equivalent scores versus chronological age. Panels (c) and (d): General conceptual ability (GCA) and development quotient (DQ) scores versus chronological age based upon cognitive score at enrollment (blue color for low scores ≤70 and red color for high scores >70). Panel (e): GCA scores versus chronological age based on biomarker burden (GAG) at trial entry (blue color for low burden ≤1181 ng/mL and red color for high burden >1181 ng/mL). In Panels a, b, c1, and d1, solid lines represent mean predicted trends and shaded bands represent 95% confidence intervals for generalized additive mixed‐effects models (GAMM)‐estimated linear predictor. In Panel (a), ball‐shaped points represent observed measurement and triangle‐shaped points represent censored observations simulated from the model to support visualization. In Panel (b): Mean trends are color‐coded for the three natural history studies reviewed in Shapiro & Eisengart (2021) 3 : blue—Young et al. (1983) 8 , red—Seo et al. (2020) 7 , green—Holt et al. (2011) 9 ; distinct point shapes correspond to distinct studies. The black dashed line represents outcome's mean trend for the three studies collectively. In Panels c1, d1, and e1, thin colored lines represent linear mixed‐effects models (LMM)‐predicted subject‐specific slopes. In Panels c2, d2, and e2, LMM‐predicted subject‐specific slopes are summarized by characteristics at the time of enrollment (boxplots).
